GMT和Pygmt提供了一个远程数据功能,可以使用函数datasets远程下载多种在线数据,并进行处理和绘图。这里以pygmt为例绘制海底地壳年龄、陆地地形。
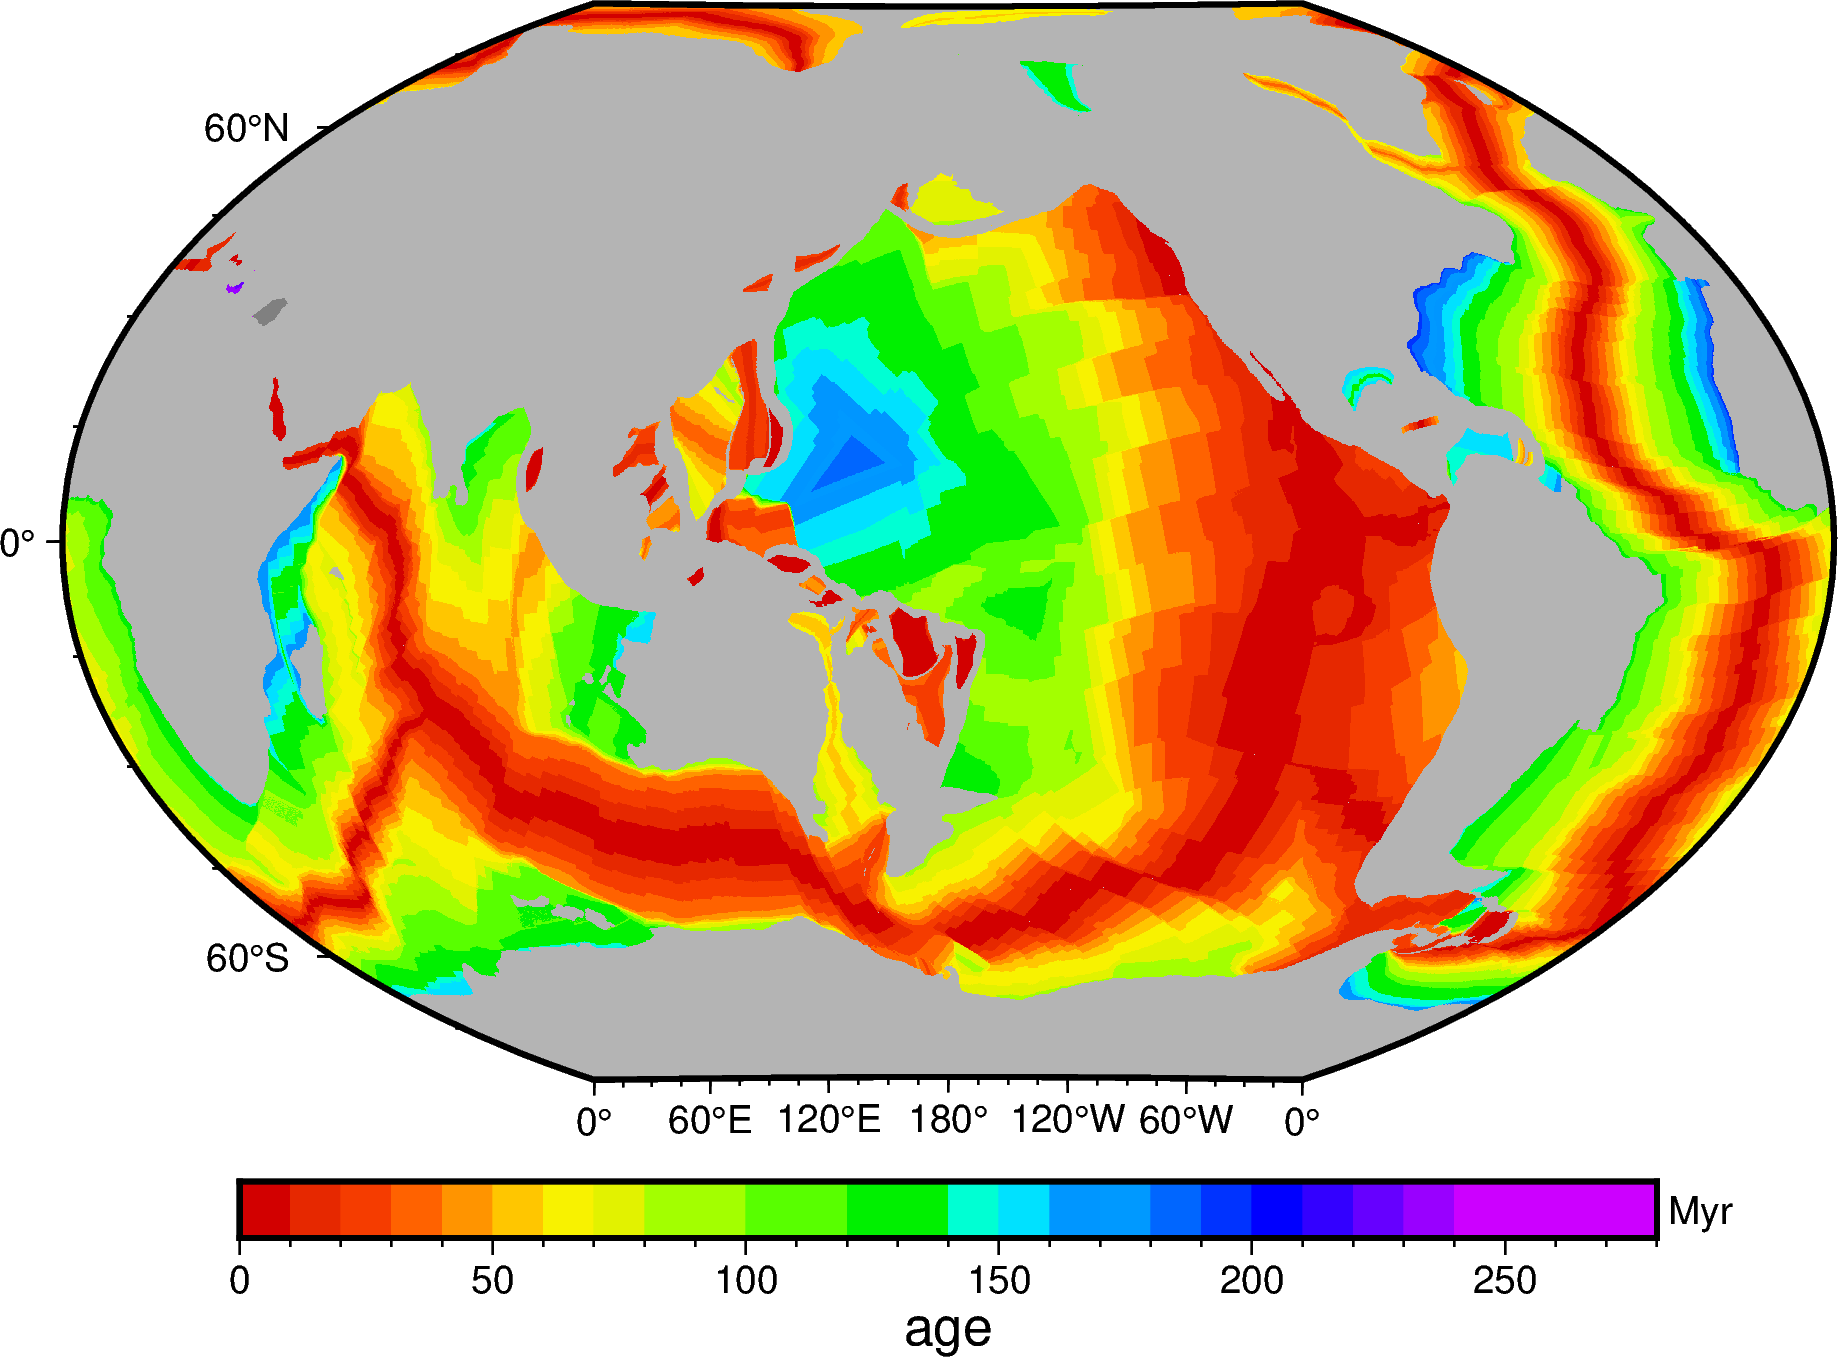
Global Earth Seafloor Crustal Age Grids
地壳数据包含了不同的分辨率,对应不同文件大小,最粗为1d,全球数据仅125K,最大分辨率1m,全球数据188M。
绘图
1 | import pygmt |
上面的调色板crustal_age可以在.gmt/cache/下找到,而远程数据也下载到了./gmt/server/下面。
地形数据
地形数据包含多种不同分辨率,对饮不同的文件大小,最粗为1d,文件大小128k,最高分辨率为1s,文件大小达41G:
SRTM绘图
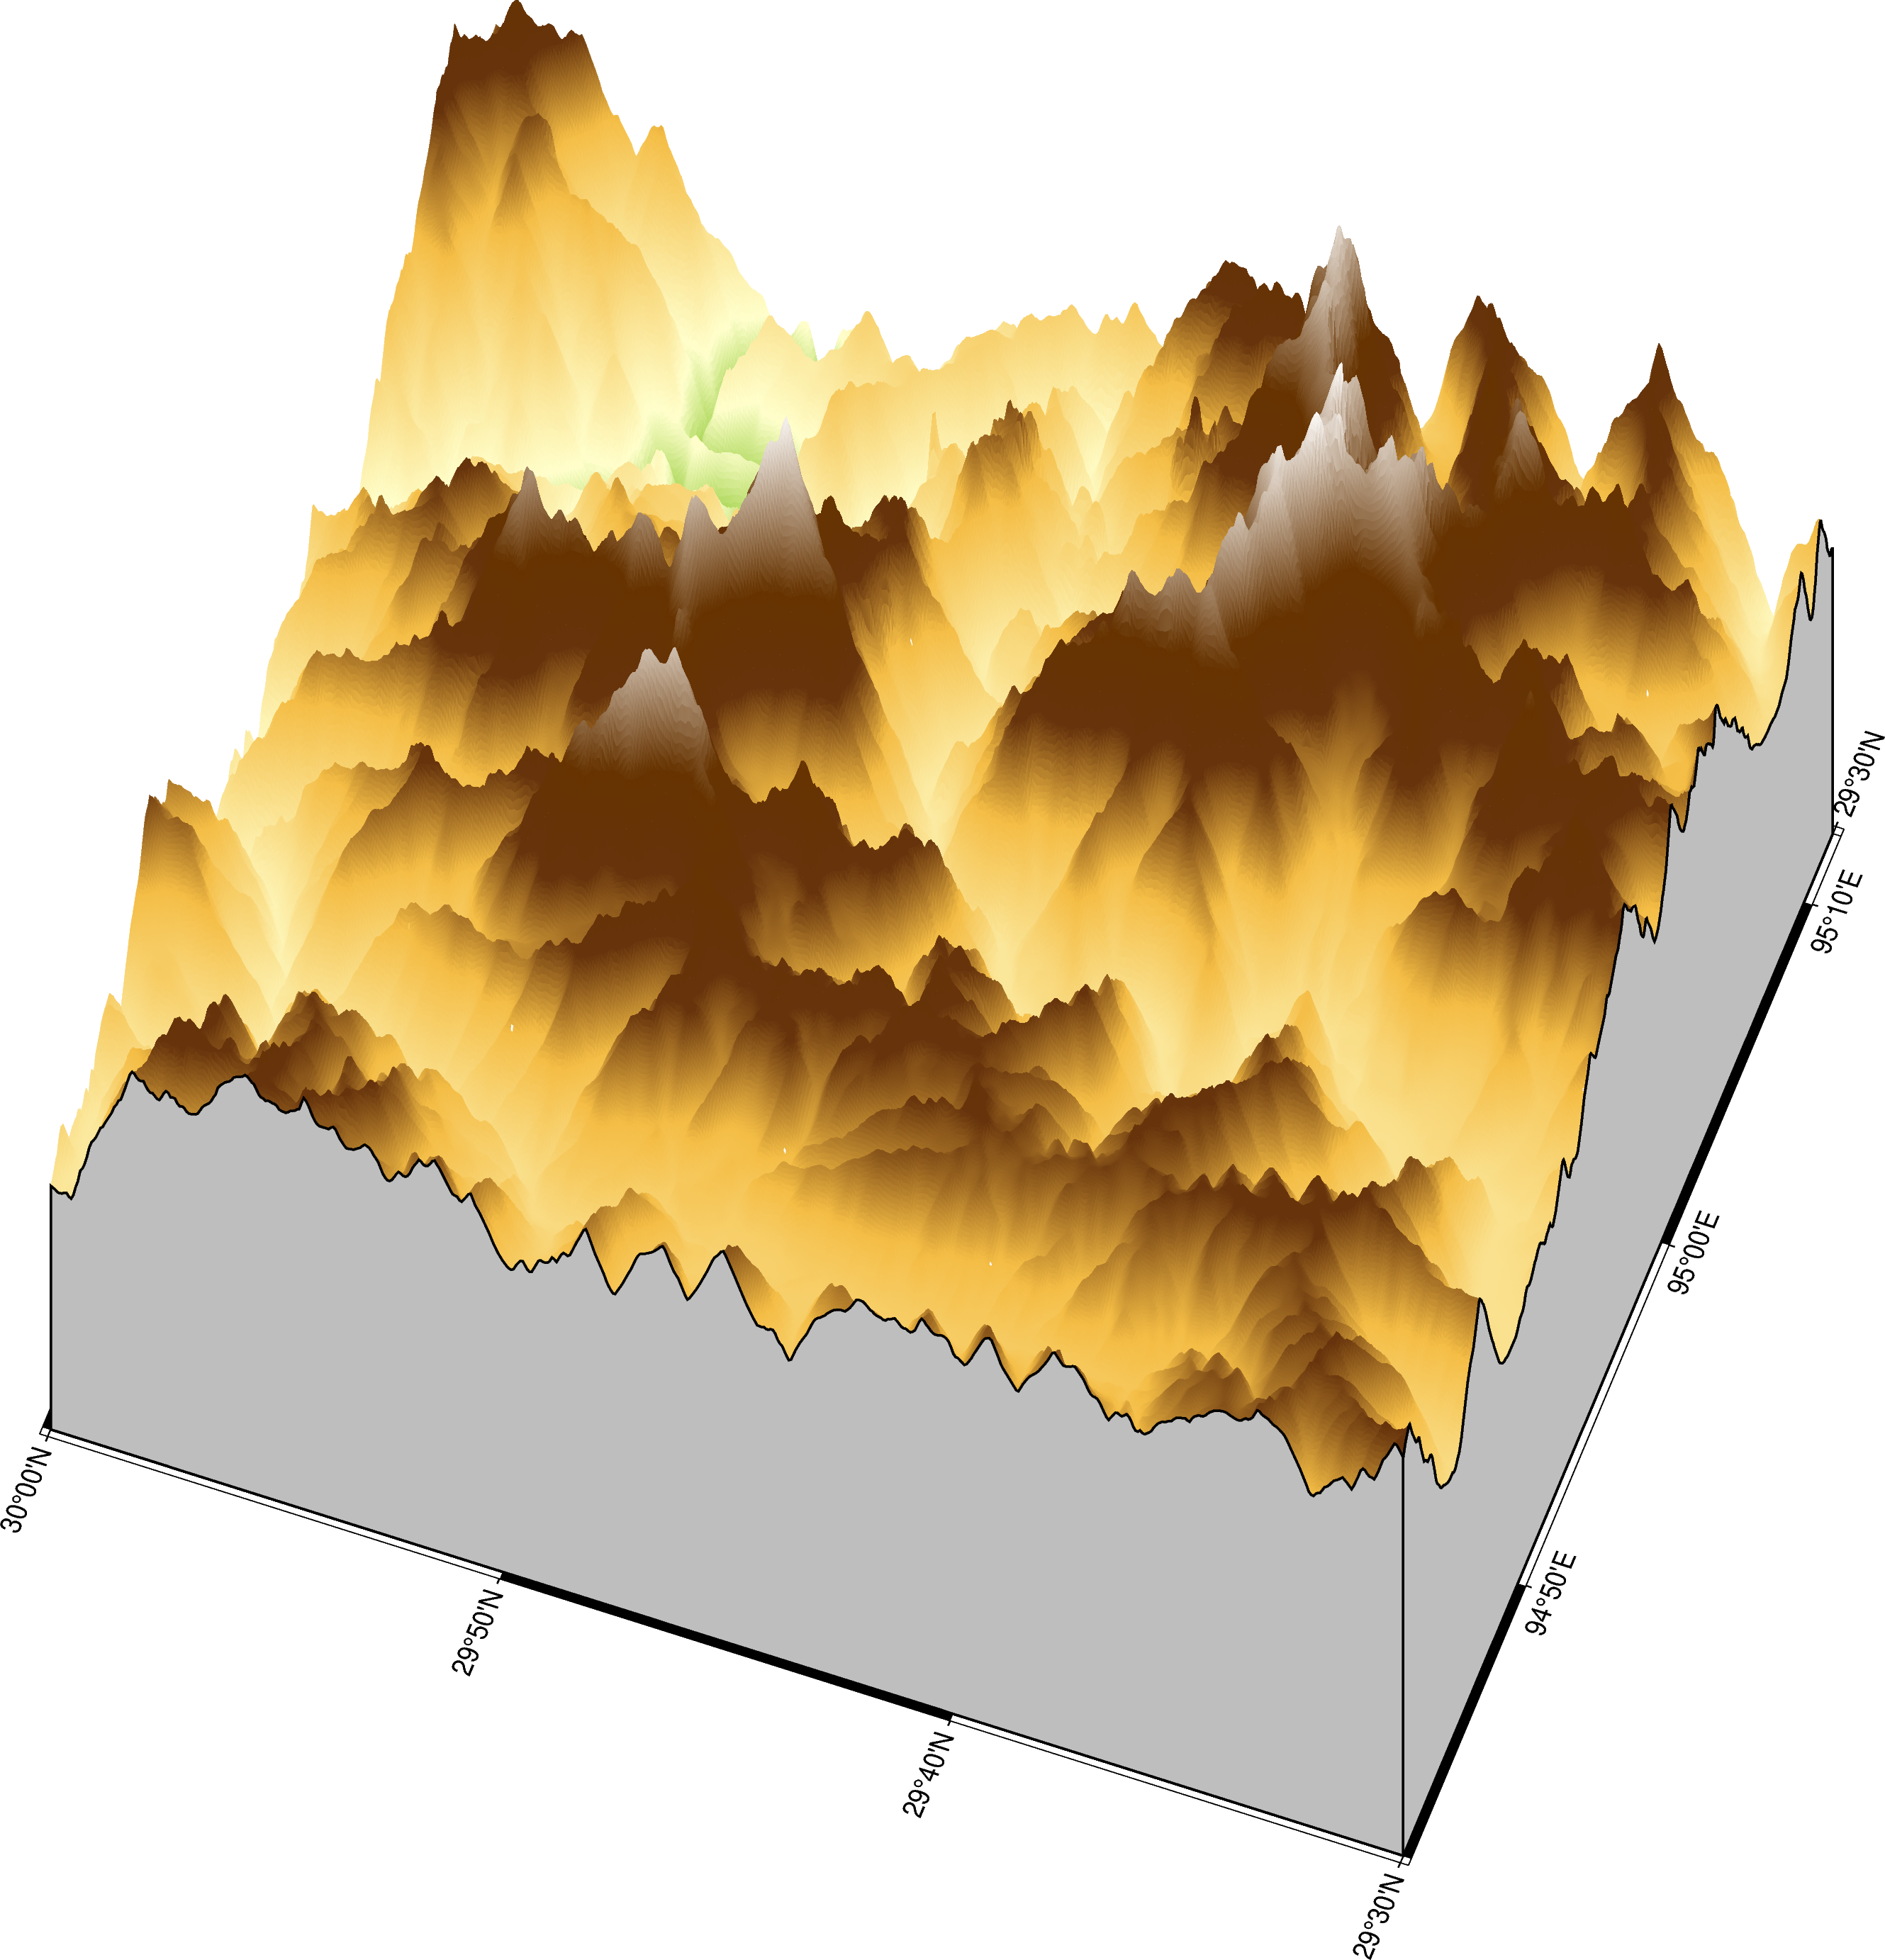
1 | # 雅鲁藏布江大峡谷 |

3D地形图
同样,我们还可以使用pygmt.grdview绘制三维地形图。
1 | fig = pygmt.Figure() |
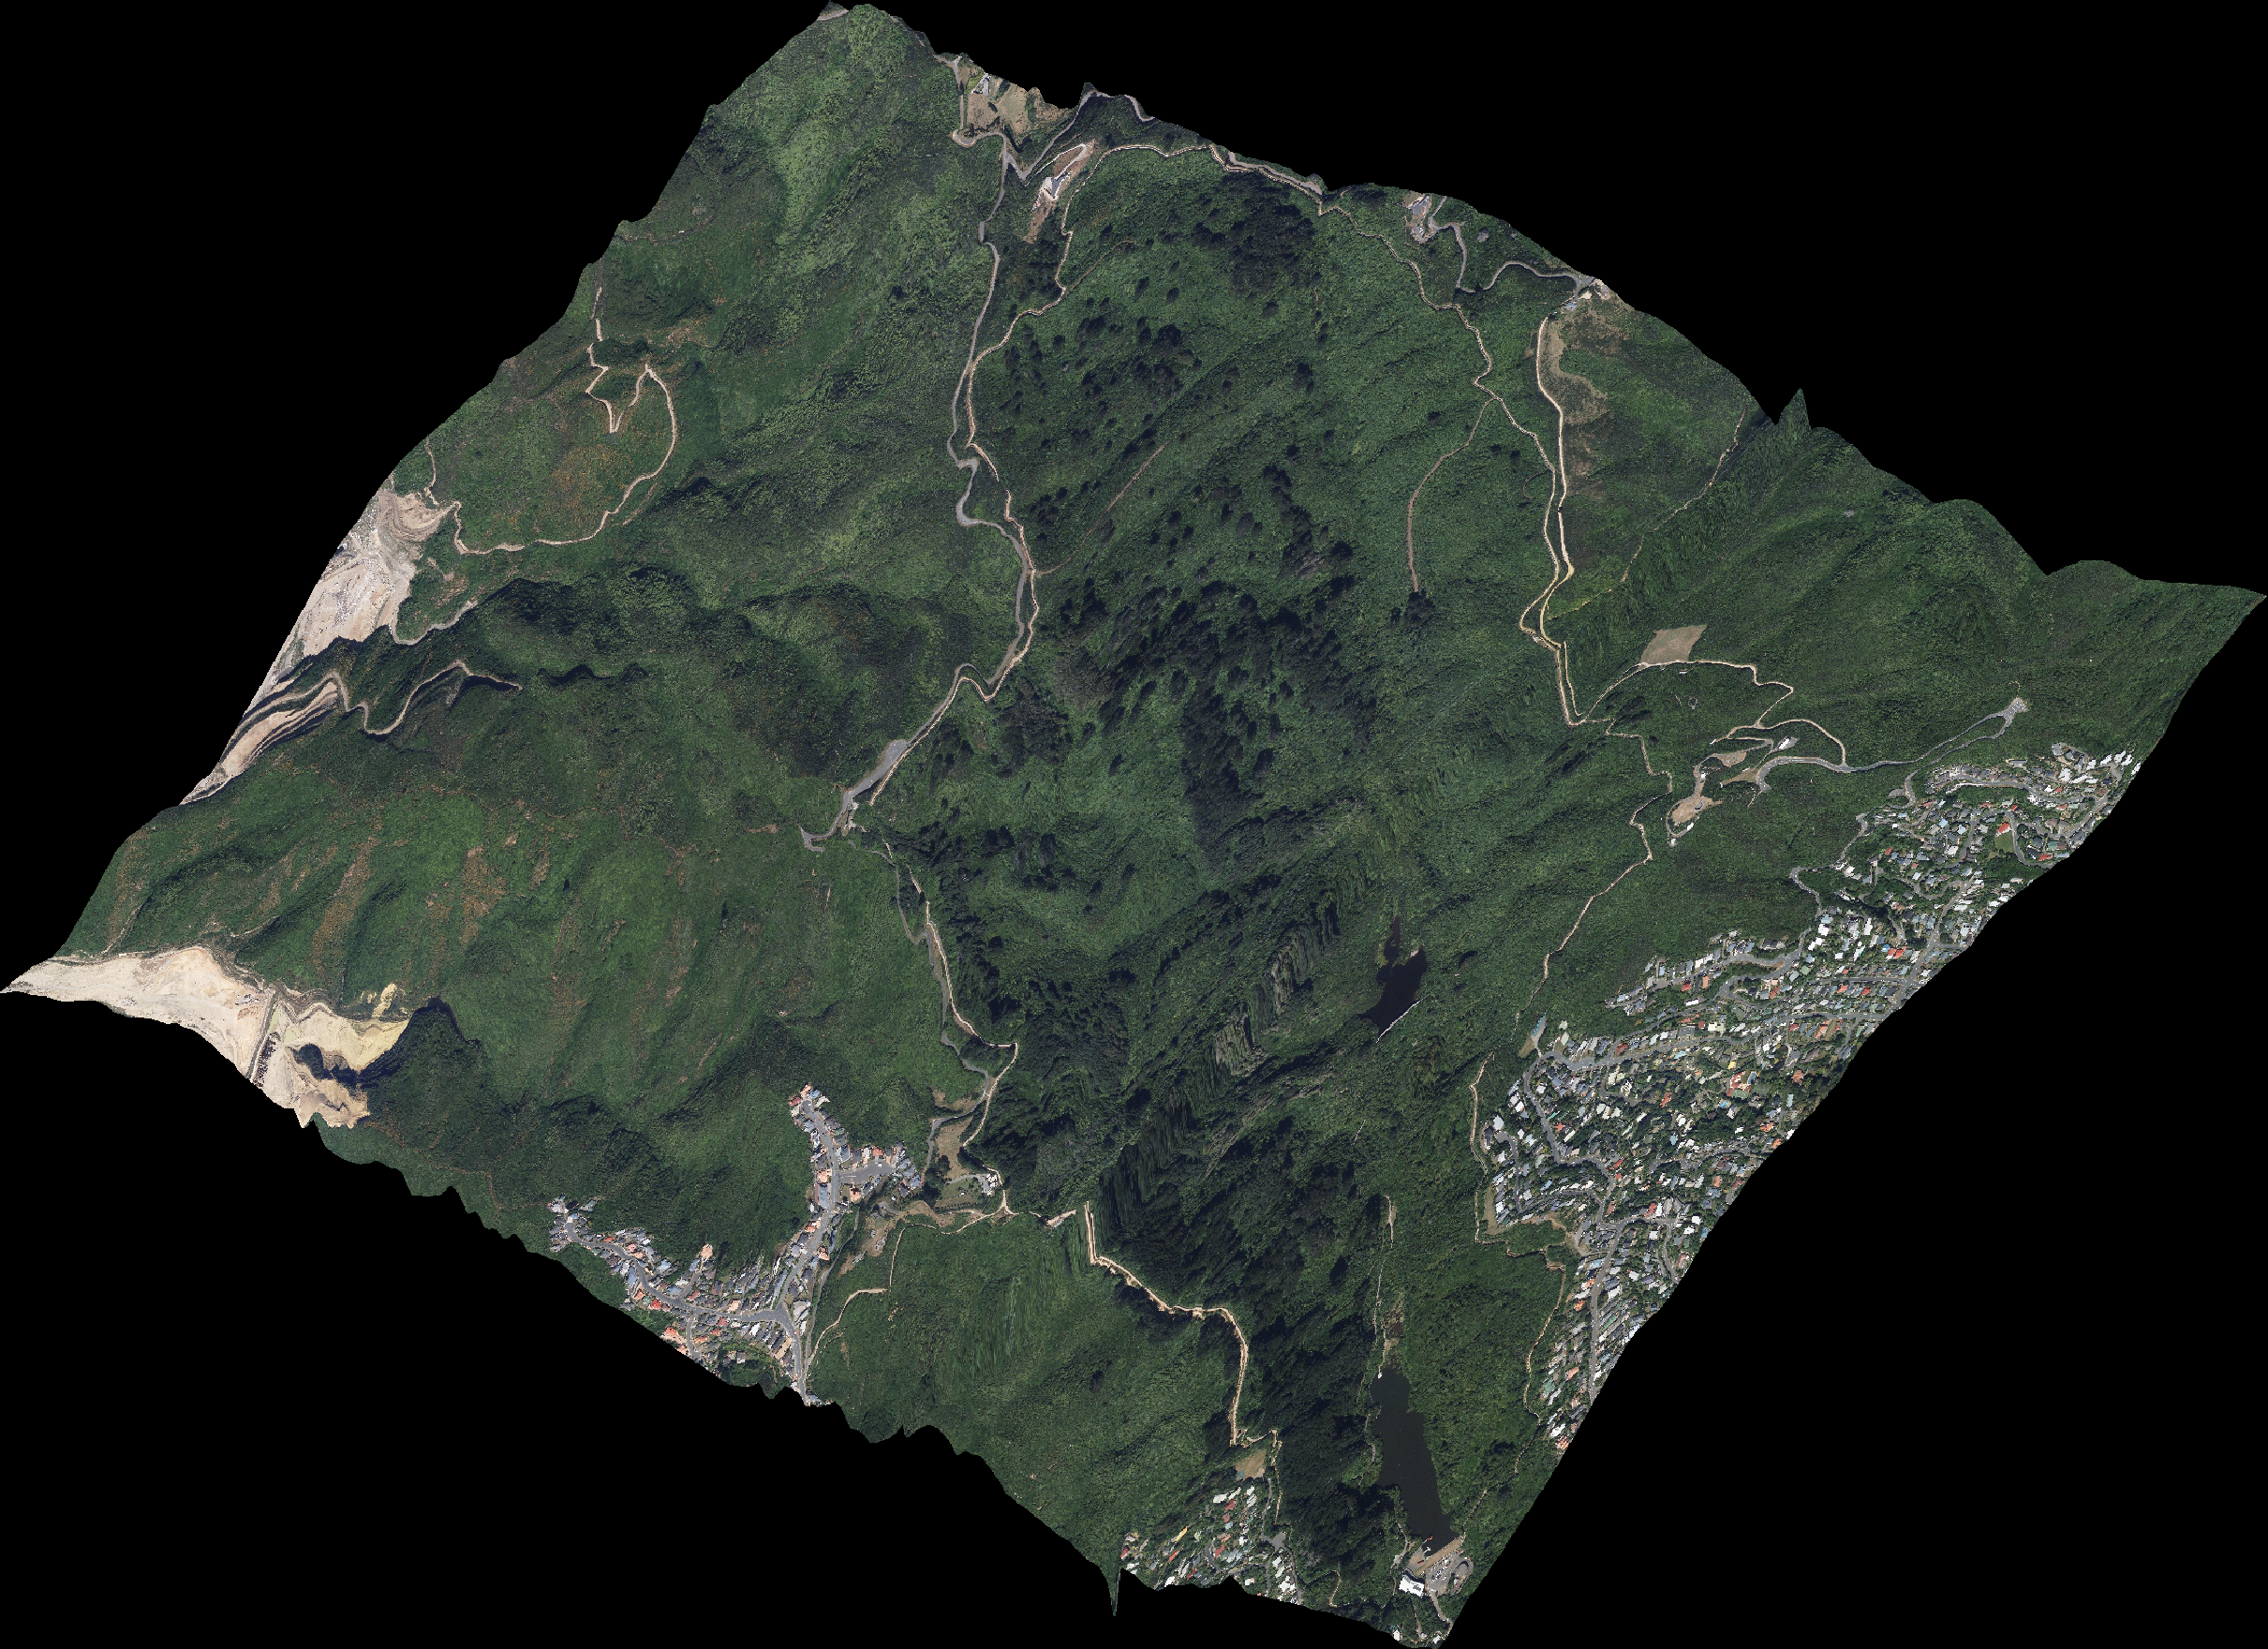
附:遥感影像和地形的结合
在github存在一个30Day*****的系列代码库,其中包含绘图领域的30DayMapChallenge2021,恰好已经使用GMT完成了这项工作,作者是Pygmt的核心开发者Weiji。
这里有两个遥感影像和地形结合的例子(17和18),可以作为很好的学习材料.