基于Pangeo的云生态系统,介绍卫星测高沿轨和网格两种产品的云计算,主要包含数据读取、绘图、时空特征分析等,并略谈并行计算。
沿轨数据
沿轨测高数据的源为Copernicus的L3级别产品,目前云端数据包含了全世界主要的测高任务,其中也有我国HY-2A:
1 | 'al', 'alg', 'c2', 'e1', 'e1g', 'e2', 'en', 'enn', 'g2', 'h2', 'j1', 'j1g', 'j1n', 'j2', 'j2g', 'j2n', 'j3', 's3a', 's3b', 'tp', 'tpn' |
导入库
1 | import fsspec |
HY-2A数据
Pangeo云端的测高数据已经转化为Zarr格式,并通过yaml文件进行元数据的规范描述,例如HY-2的元信息为:
1 | h2: |
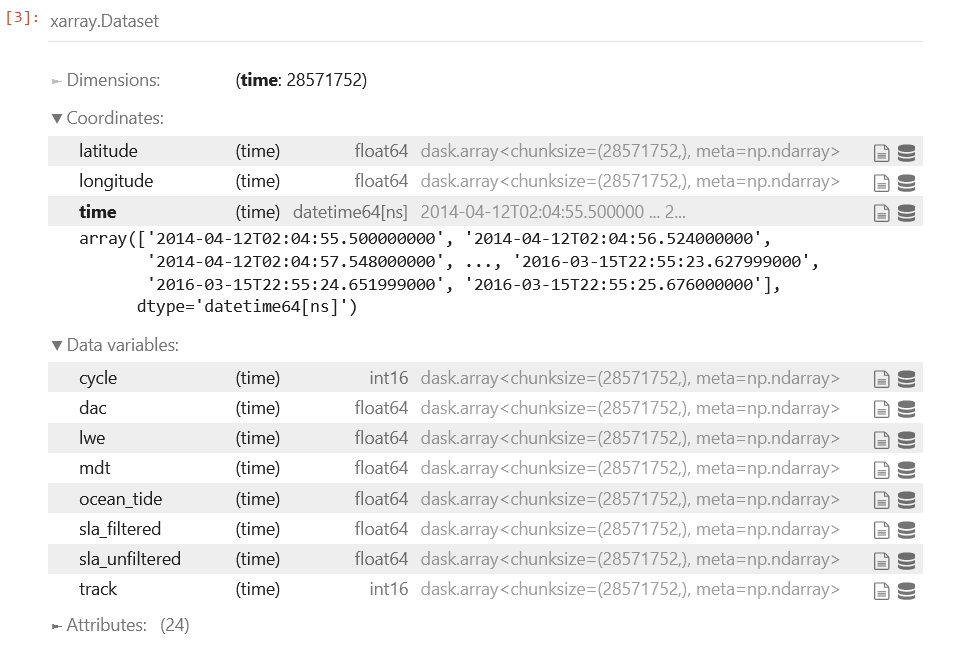
可使用intake读取卫星测高数据,使用to_dask把数据转为xarray格式,方便运算操作:
1 | from intake import open_catalog |
时间序列
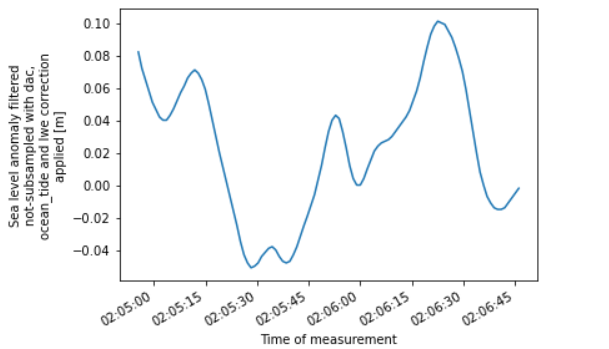
选择经纬度和SLA参数,舍弃其他参数,绘图查看。下图显示了HY-2A的100个测量点SLA,如果显示全部的轨迹点时间序列,修改slice内容包含全部时间段即可。:
1 | ds_ll = ds[['latitude', 'longitude', 'sla_filtered']] |
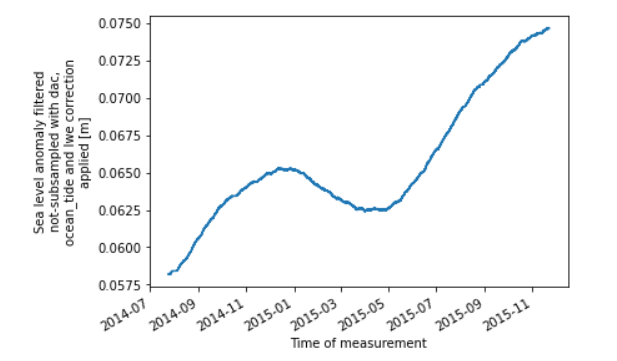
接下来计算日均值时间序列,这里使用了一个滑动平均函数rolling,计算量不算太小,但云计算表现不错,用时仅27s:
1 | tmp=ds_ll.sla_filtered.isel(time=slice(0,28571752,100)).dropna("time").rolling(time=86400, center=True).mean() |
空间分布
把所有数据载入,并简化coordinate:
1 | ds_ll = ds[['latitude', 'longitude', 'sla_filtered']].reset_coords().astype('f4').load() |
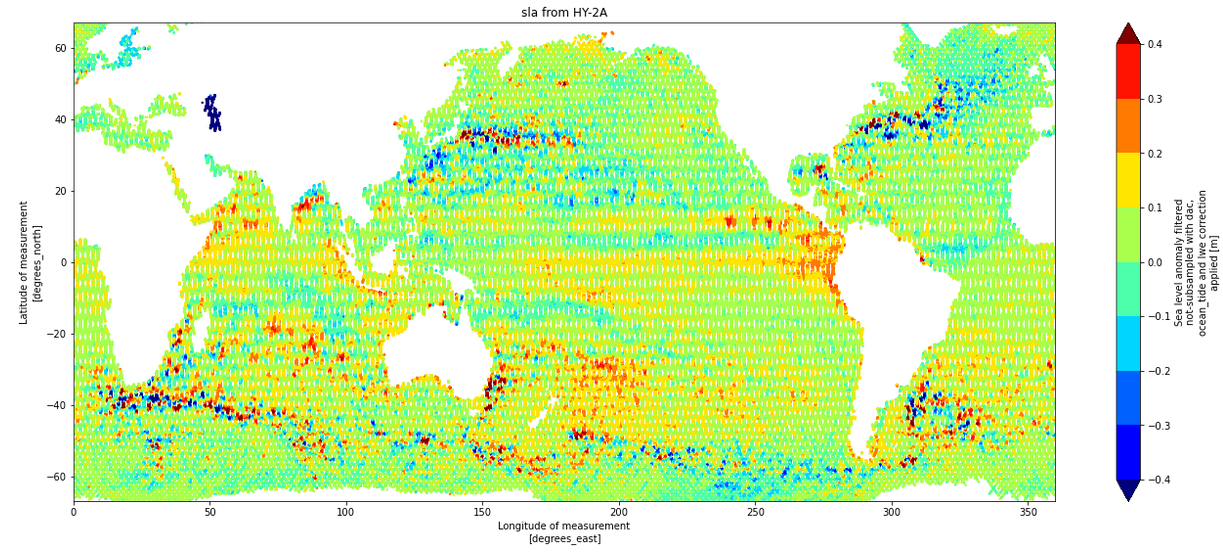
这样原本在xarray数据结构中是coordinate的经纬度就变成了variable。我们选择14天的HY-2A轨迹数据,展示空间分布图:
1 | tmp=ds_ll.isel(time=slice(86400*14)) |
空间变化
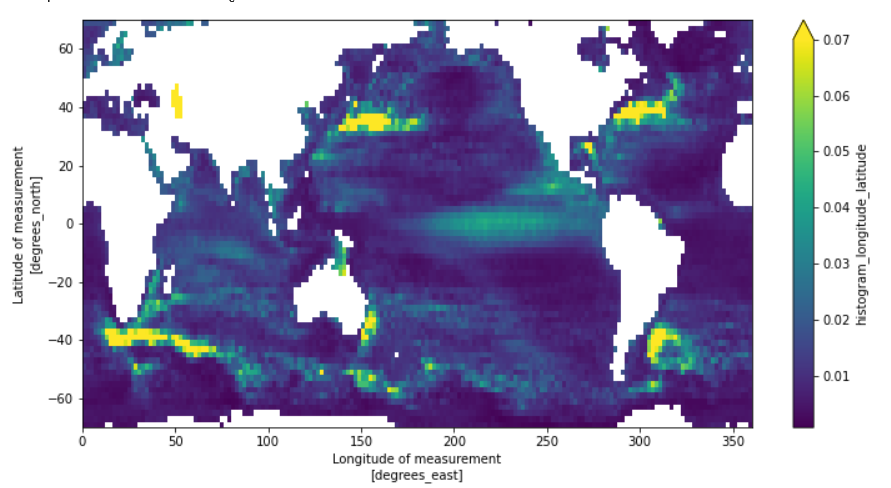
因为这里使用的不是网格文件,是轨迹文件,所以不能使用xarray的std进行网格点的变化计算,这里使用一个统计库xhistogram计算器sla的变化,也就是标准差:
1 | from xhistogram.xarray import histogram |
在几秒钟后(云计算太快了),完成全部HY-2A数据的计算,然后绘图,我们清晰的看到南极绕极流、南非大回旋、黑潮、湾流等强流特征,这表明我们国家的HY-2A数据质量很好:
1 | sla_variance.plot(y='latitude_bin', figsize=(12, 6), vmax=0.07) |
网格数据
下面是对网格测高的云计算。网格测高数据的源同样是欧洲Copernicus海洋项目,通过数据格式转化,这一批数据已经以Zarr格式存储在云端,我们使用Pangeo瞬间打开这一批巨大的数据(74G):
1 | from intake import open_catalog |
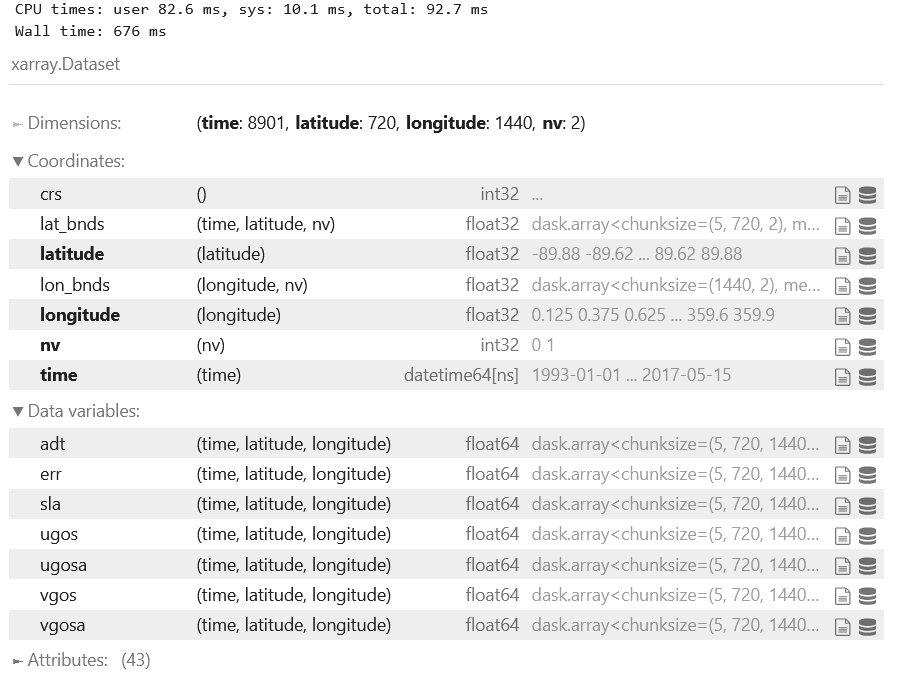
数据内容包含sla和流场。数据时间从1993年到2017年,数据不能更新是Pangeo云计算的一个弊端,不仅对测高如此,对别的云数据也一样。因此Pangeo社区后来发起了Pangeo Forge项目,召集全球学者参加众包数据计划,小编非常希望未来有人专门维护一套高质量的测高云数据。
绘图使用ds.sla.isel(time=0).plot()即可,速度也是秒级,这里不展示。
时间序列
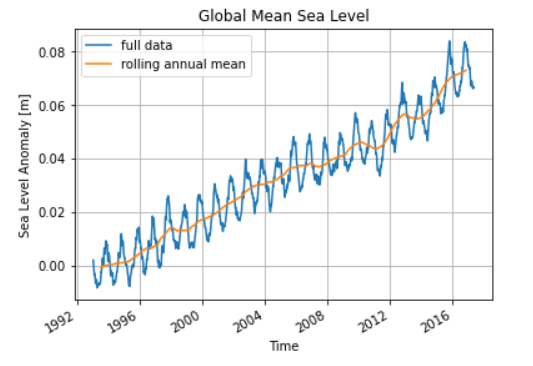
计算每一个网格文件(约9000个)的均值,得到全球海面高度日均时间序列,这一步计算相对消耗时间,大约用时1-2min:
1 | sla_timeseries = ds.sla.mean(dim=('latitude', 'longitude')).load() |
对数据进一步做年滑动平均,然后绘图:
1 | sla_timeseries.plot(label='full data') |
空间变化
进一步,我们想研究海平面变化的经纬方向空间变化,这需要仅对一个维度进行求均值,这样绘制的图形时间沿横坐标,而SLA沿纵坐标(仿Hovmöller diagram)。
1 | sla_hov = ds.sla.mean(dim='longitude').load() |
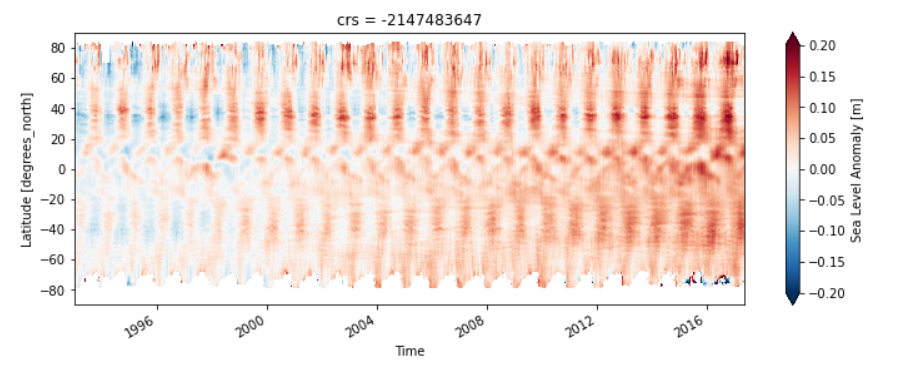
可以看到北纬40°有特别显著的强变化区,那里是西边界流导致的黑潮和湾流区,赤道也有一个随时间变化的流场,呈现了正弦分布。这张图中的科学太多了,小编一时无法完整解读,有兴趣的读者可以研究下。
同样我们也能研究SLA在南北向的变化时间序列。此处略。
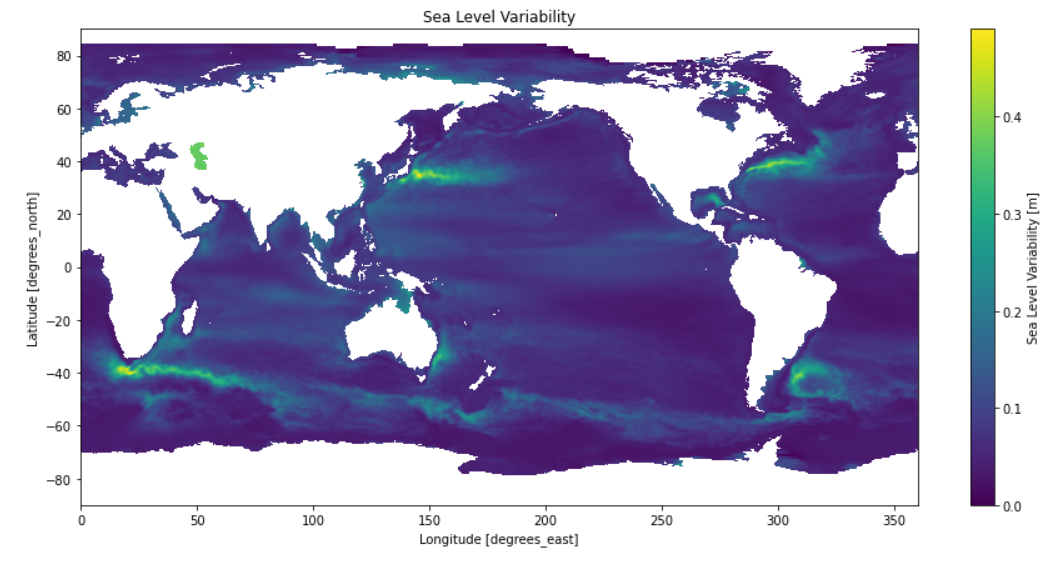
STD空间分布
因为是网格文件的时间序列,这里可以使用xarray对每一个固定网格点的时间轴做计算,同样计算量大,也略消耗时间,耗时2min。有兴趣的话,此处可以使用dask来并行计算,时间快一倍(1min)。因为dask的启动时间和任务分配时间较长,因此综合来看,小的计算量节约时间有限,甚至还慢。大数据计算耗时在1小时之上可尝试dask并行计算。
1 | sla_std = ds.sla.std(dim='time').load() |
Dask并行计算
本次并行计算视频:
小结
- 测高云计算比较方便,计算速度快,数据无需下载
- Pangeo生态系统成熟,并行计算可急速大型计算
下节预告
下节将准备一些复杂的云计算:
- FIO模式大数据处理、混合层计算
- KE计算和谱分析