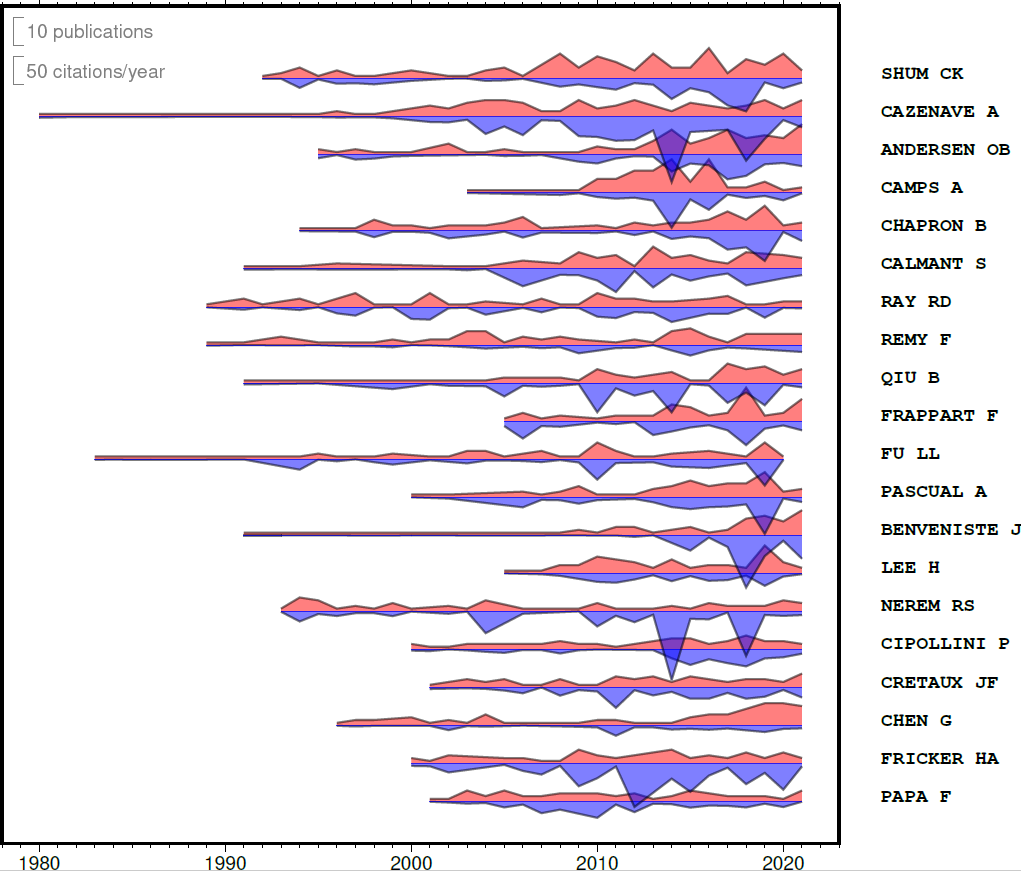
1
2
3
4
5
6
7
8
9
10
11
12
13
14
15
16
17
18
19
20
21
22
23
24
25
26
27
28
29
30
31
32
33
34
35
36
37
38
39
40
41
42
43
44
45
46
47
48
49
50
51
52
53
54
55
56
57
58
59
60
61
62
63
64
65
66
67
68
69
70
71
72
73
74
75
76
77
78
79
80
81
82
83
84
85
86
87
88
89
90
91
92
93
94
95
96
97
98
99
100
101
102
103
104
105
106
107
108
109
110
111
| df = pd.read_csv(r".\author\Author_Production_Over_Time.csv")
au=df['Author']
fig = pygmt.Figure()
fig.basemap(region=[1978, 2023, -20, 200], projection="X15c/15c", frame=["Snlr", "xaf1"])
fruits = au.unique()
fruits=fruits[::-1]
k=-10
for index in range(len(fruits)):
print ('Present author : %s' % fruits[index])
z=df['freq'][df['Author']== fruits[index]]
x=df['year'][df['Author']== fruits[index]]
y=np.ones(x.values.size)+k
k=k+10
if k == 0:
fig.wiggle(
x=x.values,
y=y,
z=z.values,
# Set anomaly scale to "20c"
scale="20",
# Fill positive and negative areas red and gray, respectively
color=["red+p", "gray+n"],
# Set the outline width to "1.0p"
pen="1.0p",
# Draw a blue track with a width of 0.5 points
track="0.5p,blue",
# Plot a vertical scale bar at the right middle. The bar length is 100 in
position="jLT+w10+lpublications+o0.2/0.2",
transparency=50,
)
else:
fig.wiggle(
x=x.values,
y=y,
z=z.values,
# Set anomaly scale to "20c"
scale="20",
# Fill positive and negative areas red and gray, respectively
color=["red+p", "gray+n"],
# Set the outline width to "1.0p"
pen="1.0p",
# Draw a blue track with a width of 0.5 points
track="0.5p,blue",
transparency=50,
)
k=-10
for index in range(len(fruits)):
print ('Present author : %s' % fruits[index])
z=df['TCpY'][df['Author']== fruits[index]]
x=df['year'][df['Author']== fruits[index]]
y=np.ones(x.values.size)+k
k=k+10
if k == 0:
fig.wiggle(
x=x.values,
y=y,
z=-z.values,
# Set anomaly scale to "20c"
scale="100",
# Fill positive and negative areas red and gray, respectively
color=["red+p", "blue+n"],
# Set the outline width to "1.0p"
pen="1.0p",
# Draw a blue track with a width of 0.5 points
track="0.5p,blue",
# Plot a vertical scale bar at the right middle. The bar length is 100 in
position="jLT+w50+lcitations/year+o0.2/0.9",
transparency=50,
)
else:
fig.wiggle(
x=x.values,
y=y,
z=-z.values,
# Set anomaly scale to "20c"
scale="100",
# Fill positive and negative areas red and gray, respectively
color=["red+p", "blue+n"],
# Set the outline width to "1.0p"
pen="1.0p",
# Draw a blue track with a width of 0.5 points
track="0.5p,blue",
transparency=50,
)
k=-10
for index in range(len(fruits)):
k=k+10
fig.text(
region=[1978, 2030, -20, 200],
projection="X20c/15c",
x=2017,
y=1+k-10,
text=fruits[index],
font="Courier-Bold",
justify="BL",
offset="0.75c/0c",
)
fig.show()
|


