波浪骑士是测量海浪的经典设备,目前市场最常见的有荷兰Datawell公司的Waverider产品,其成熟产品主要有两种:加速度计类型和GNSS类型。
波浪骑士采集的数据有专门的软件进行读取和处理,本文以Datawell 数据为例简单总结处理方法。
软件下载
下载Waves5软件并安装,安装无需注册。
导入数据
新建项目,并将存放数据的文件夹导入。之后,数据文件将在左侧栏的Logged中显示。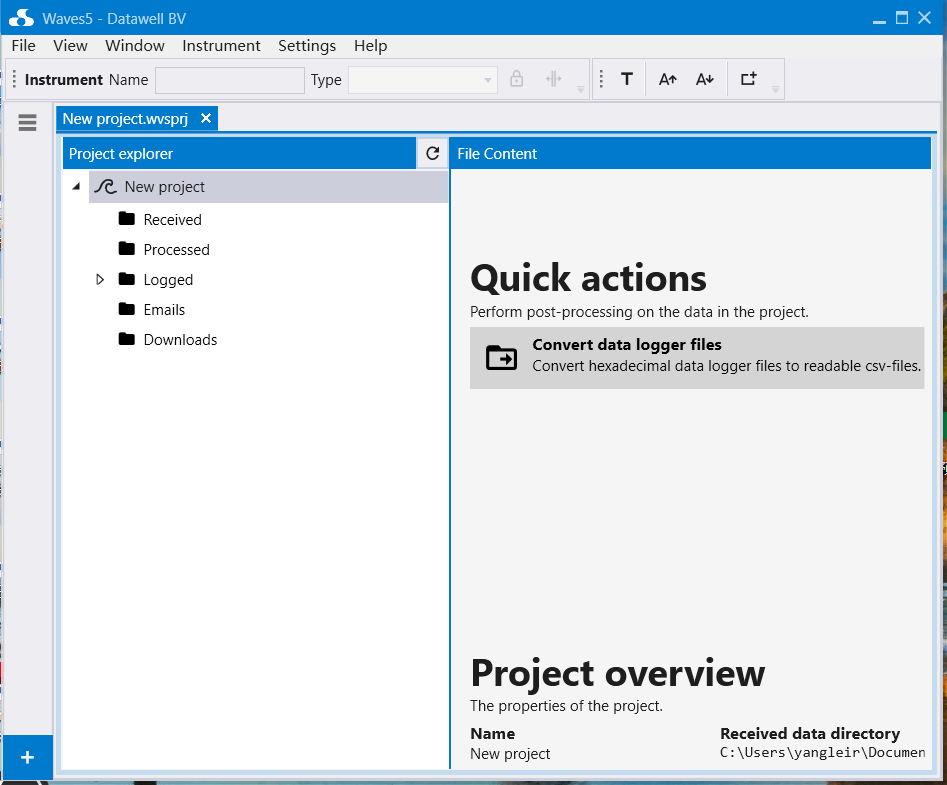
其数据格式主要有raw,hxv,wvs,spt。
数据格式
1、hxv:Raw buoy messages
Meaning: HeXadecimal Vectors
Description: Stream of raw buoy messages
Buoys: DWR MkI, MkII, MkIII
From: HF receiver
Format: Ascii/Text, hexadecimal
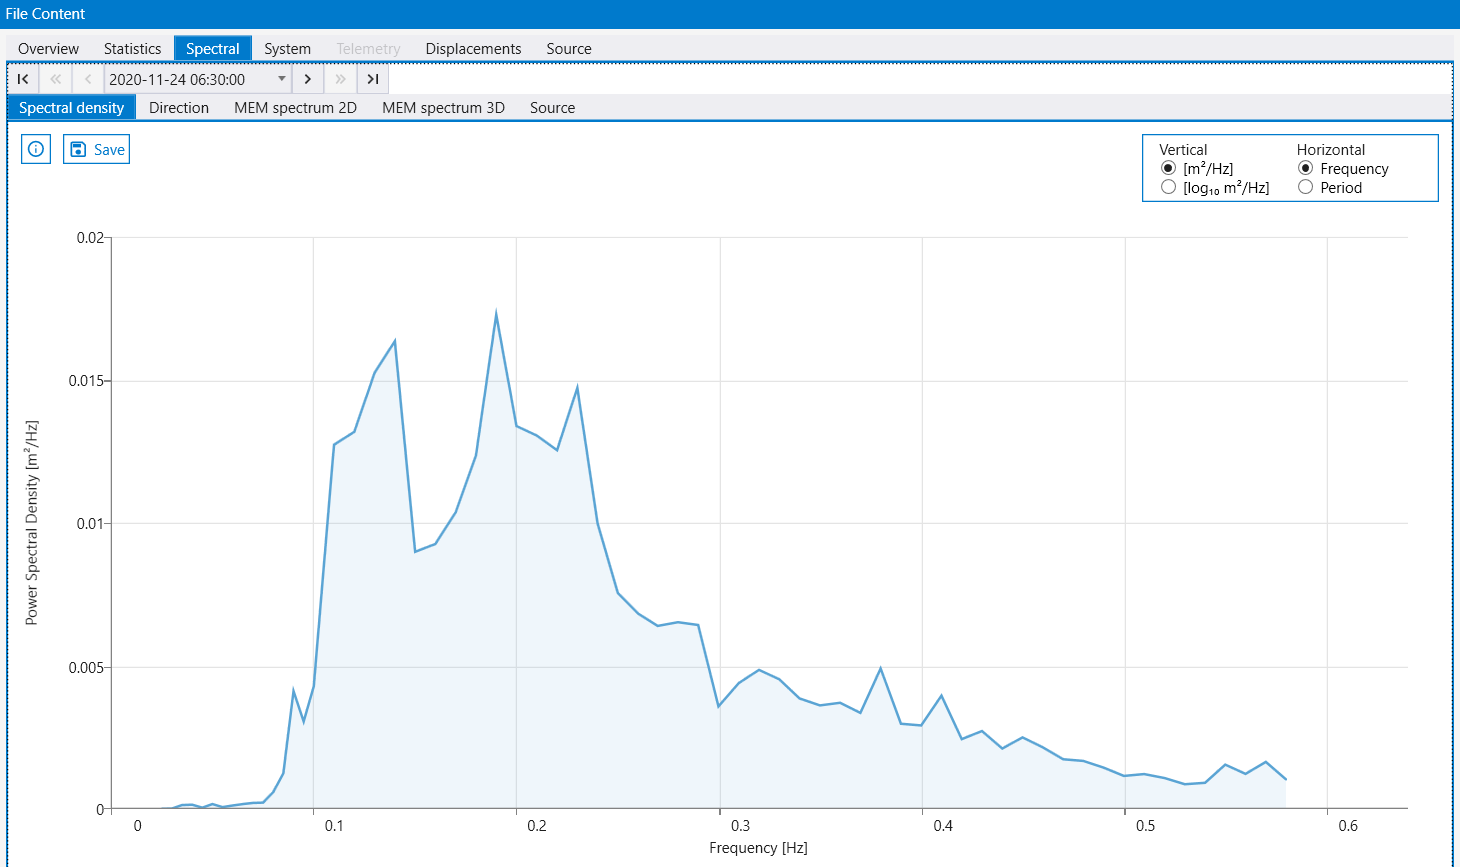
该数据包含了浮标的原始记录,半小时一个文件,通过右侧工具栏可以查看统计信息、波浪功率密度谱、二维和三维方向谱。
数据样例
00A4,8B53,80C0,0501,92B7
00A5,A1AB,8040,0101,A978
00A6,C3D7,00D0,0502,5EDF
00A7,65C6,0160,1C01,8E58
数据格式
Format
SSNN,YYYY,HHHN,NNWW,WPPP
SS: status
00: correct
01: transmission error, repaired
02: transmission error, not repaired
03: all-0 or all-1 vector
04: synchronizing
05: = 04 + 01
06: = 04 + 02
07: = 04 + 03
NN: index, 0-255, modulo 256
YYYY: spectral/system word
HHH: heave (vertical displacement), 12 bit, sign-magnitude
NNN: north displacement, 12 bit, sign-magnitude
WWW: west displacement, 12 bit, sign-magnitude
PPP: Parity, BCH(63,51)-code
2、raw: raw buoy displacements
Meaning: RAW displacements
Description: the heave, north, west displacements @ 1.28 Hz
Buoys: DWR MkI, MkII, MkIII
From: post-processing
Format: Ascii/Text, decimal
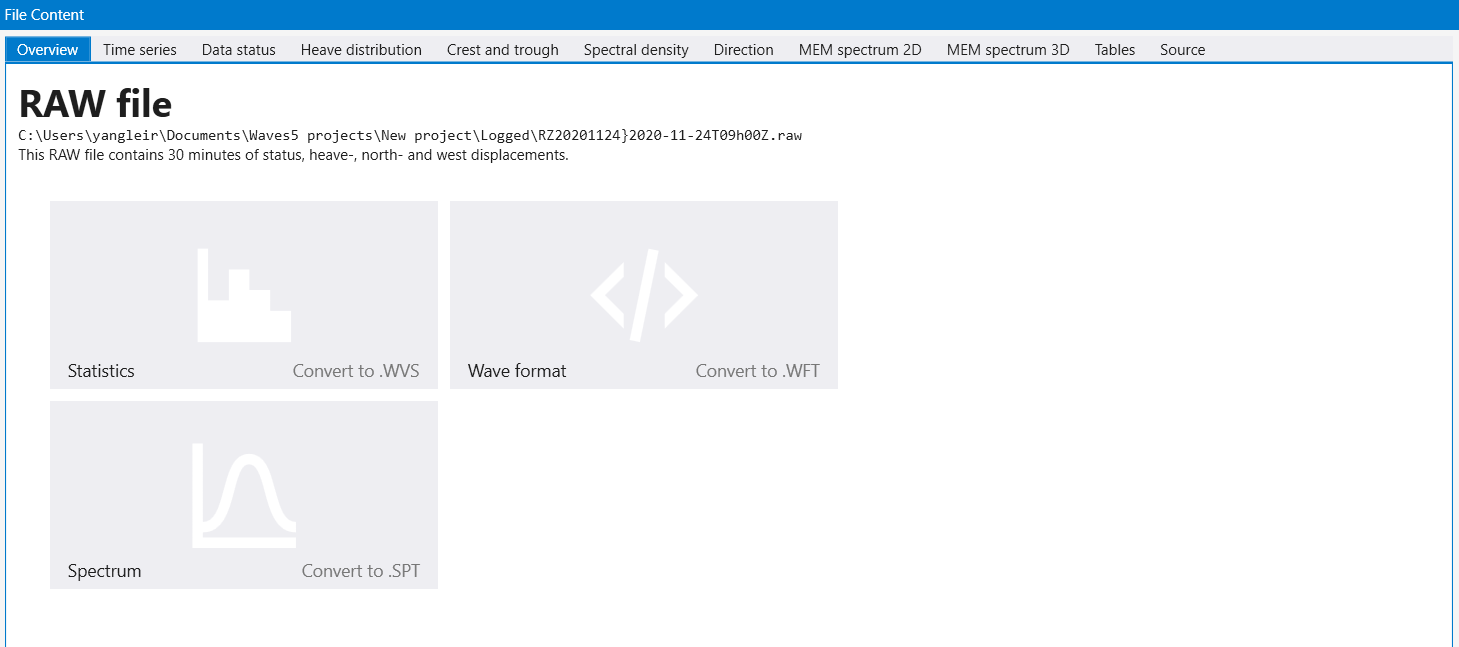
该数据包含了浮标的位移信息,通过右侧工具栏可以查看时间序列、波浪功率密度谱、二维和三维方向谱。
数据样例:
0, 13, 3, -13
0, 3, 13, -13
0, 15, 17, -11
0, -10, 2, -1
数据格式
Format
sta, hv, no, we
sta: status
0 to 7: see *.HXV
16: one of the three displacements outside +/- 4s.
32: two of the three displacements outside +/- 4s.
48: all three displacements outside +/- 4s.
64: dummy vector to replace unreceived vector
128: gap in GPS link (DWR-G buoys only)
hv: heave [cm]
no: north displacement [cm]
we: west displacement [cm]
3、WVS:the chronological list of upcross waves
Meaning: upcross WaVeS data
Description: the chronological list of upcross waves
Buoys: DWR MkI, MkII, MkIII
From: post-processing
Format: Ascii/Text, decimal
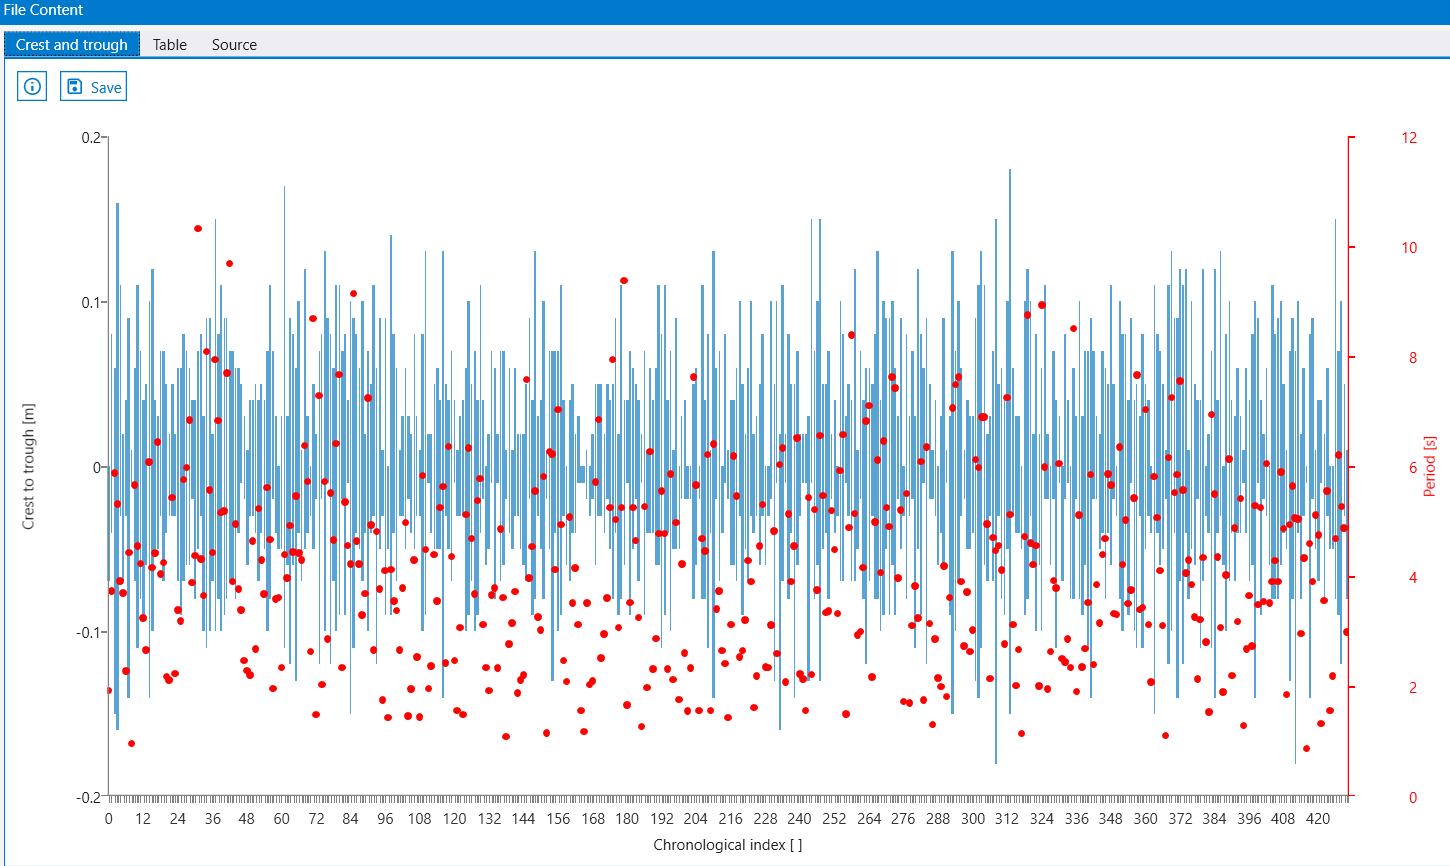
该数据包含了按时间排列的波浪主要信息,通过右侧工具栏可以查看波峰、波谷和周期信息。
数据样例
2012-01-25T05:00:00.000,100, 116, 4.1, 78, 4.0, 62, 3.9, 40, 3.2, 0.534,553
171, 28, -21, 4.071
451, 14, -7, 2.835
385, 8, -20, 2.637
15, 32, -49, 3.230
数据格式
Format
Summary (12 parameters) .
Timestamp: date and time (ISO8601)
Coverage: percentage of raw data used in constructing the upcross waves [%]
Hmax: maximum wave height [cm]
T(Hmax): period of the highest wave [s]
H[1/10]: mean height of the highest 1/10 of the waves [cm]
T(H[1/10]): mean period of the highest 1/10 of the waves [s]
H[1/3]: mean height of the highest third of the waves [cm]
T(H[1/3]): mean period of the highest third of the waves [s]
Hav: mean height of all waves [cm]
Tav: mean period of all waves [s]
eps: bandwidth parameter [-]
NumWaves: number of upcross waves [-]
List of upcross waves (NumWaves x 4 matrix) .
rank, crest, trough, period
rank: index of wave when sorted ascendingly (1 = highest)
crest: maximum heave within present upcross wave
trough: minimum heave within present upcross wave
period: duration of present upcross wave
NB: the wave height of an upcross wave is the difference between crest and trough.
4、spt:the heave and directional spectrum
Meaning: SPecTral data
Description: the heave and directional spectrum
Buoys: DWR MkI, MkII, MkIII
From: post-processing
Format: Ascii/Text, decimal
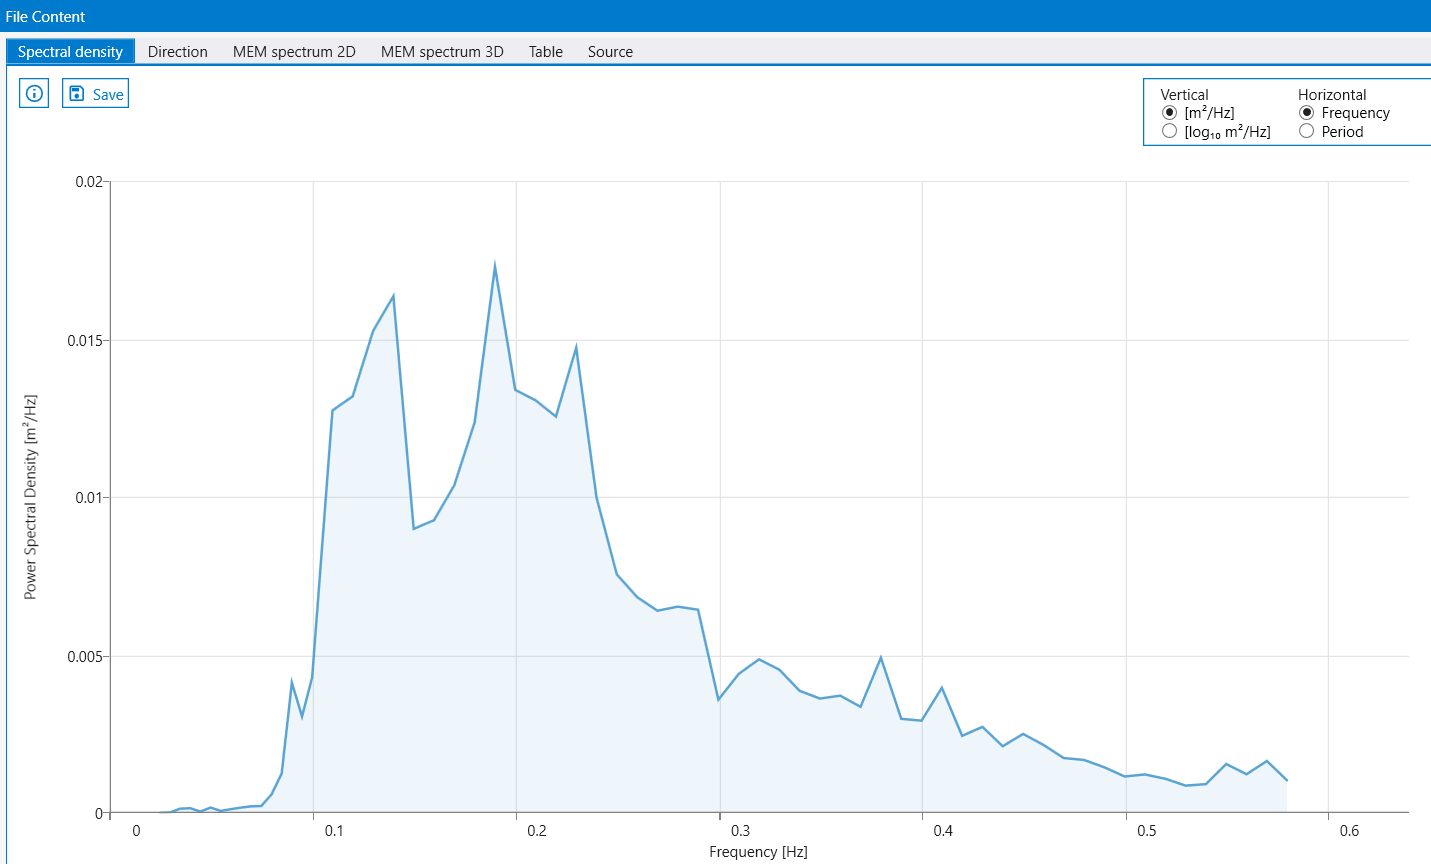
该数据包含了按时间排列的波浪谱信息。
数据样例:
10
22.0
3.774
1.7287E-2
25.00
14.30
7
0.04125
-0.04500
0.07750
260.2
53.833
0.025,9.9040E-5,60.5,78.6,-2.95,1.71
0.030,6.6547E-4,99.8,69.2,3.77,2.47
0.035,7.6734E-3,279.8,46.3,-0.37,4.47
0.040,8.4804E-3,292.5,67.5,4.55,2.50
数据格式
Format
System file (12 parameters)
tn: transmission index (1 to 8)
Hs: significant wave height [cm]
Tz: zero-upcross period [s]
Smax: maximum of the psd S(f) [m^2/Hz]
Tref: reference temperature [°C, centigrade]
Tsea: Sea surface temperature [°C, centigrade]
Bat: Battery status (0 = empty to 7 = full)
Av: offset of the vertical accelerometer
Ax: offset of the x-accelerometer
Ay: offset of the y-accelerometer
Ori: buoy orientation [°]
Incli: magnetic inclination [°]
Spectrum file (64 x 6 array)
f, S(f) / Smax, Dir(f), Spr(f), Skew(f), Kurt(f)
f: wave frequency [Hz]
S(f) / Smax: relative psd (power spectral density) [-]
Dir(f): wave direction [°]
Spr(f): directional spread [°]
Skew(f): skewness of the directional distribution [-]
Kurt(f): kurtosis of the directional distribution [-]
波浪能量密度谱计算方法
能量密度谱主要包含一下信息:
能量:海面高度波动的方差。
能量密度谱:积分之后即能量。
周期:峰值即周期(频率)。
使用Matlab可做如下计算和测试:
1 | % Load spectral density data From SPT file |
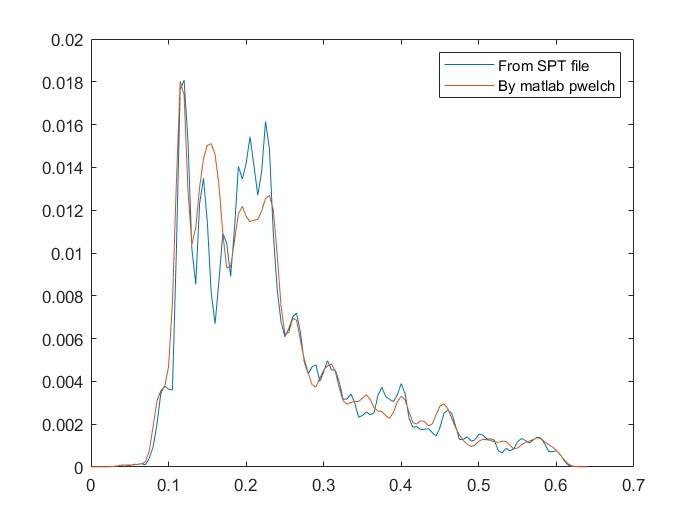
可见使用波浪骑士的原始波动数据计算PSD和SPT文件中的PSD是符合的。所以采集数据之后,既可以使用wave5进行数据处理,也可以自己编程实现,二者一致。
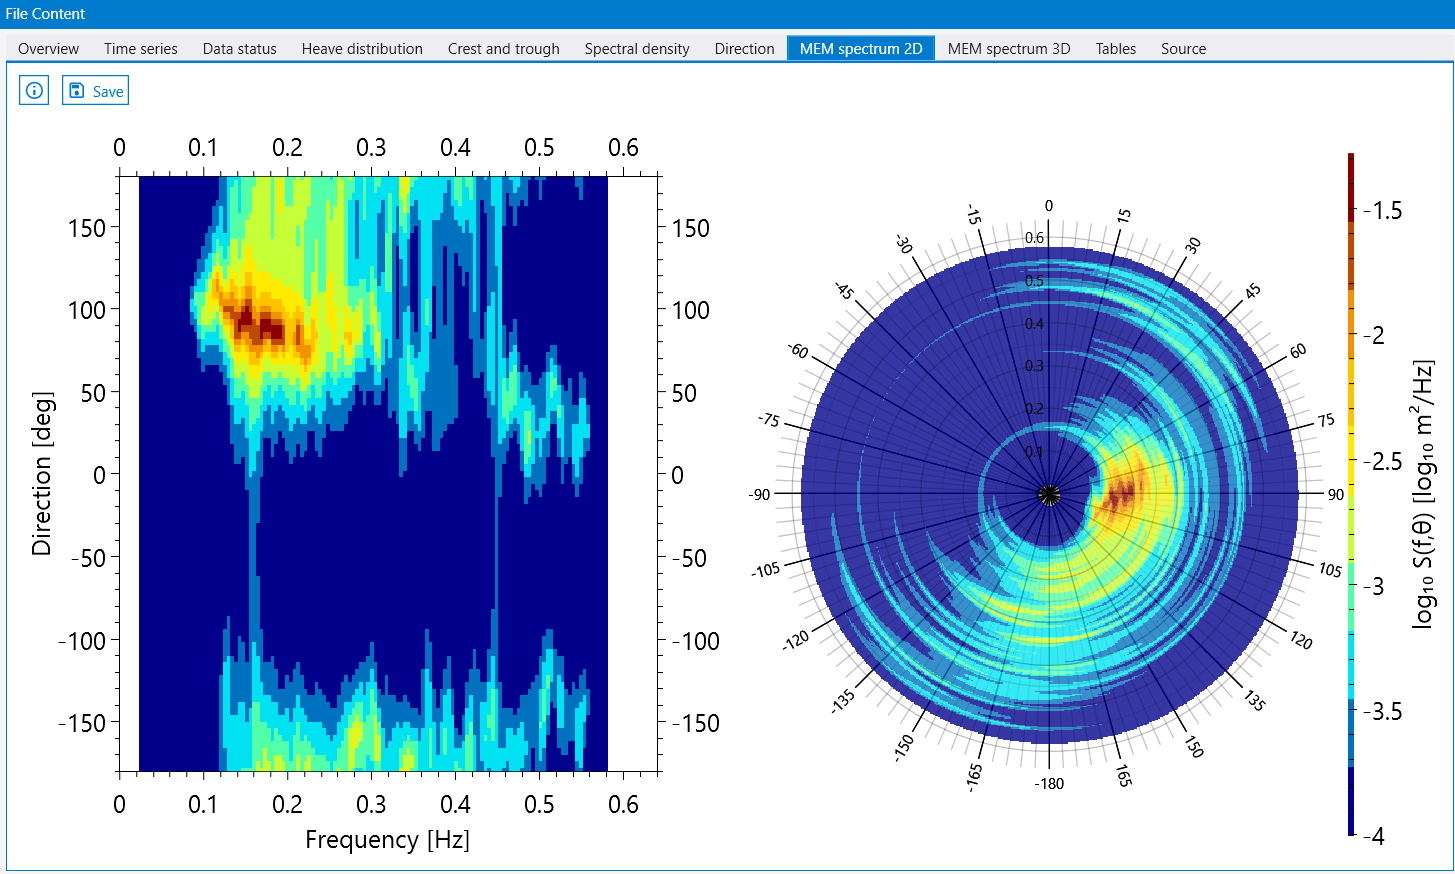
方向谱
波浪骑士可观测海浪的三个方向的加速度,进而可以通过交叉谱确定方向谱。
Maltab开源程序包diwasp也可以独立计算方向谱,下面比较Wave5软件和diwasp计算方向谱的差异。
Matlab程序
1 |
|
结果为: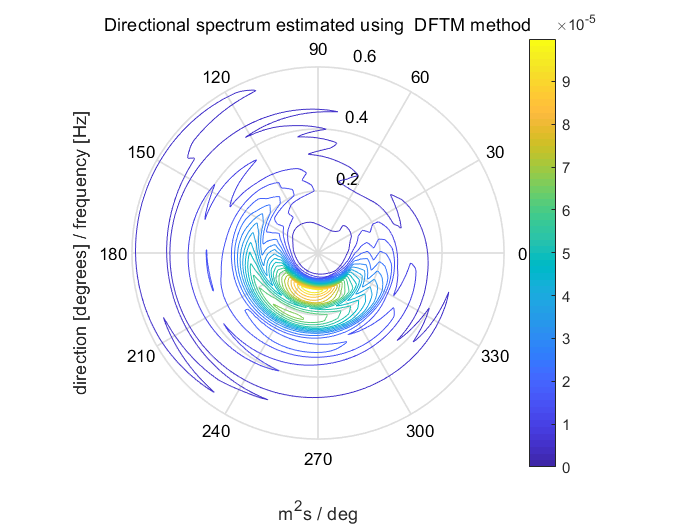
MATLAB计算的方向谱和波浪骑士自带工具显示的方向谱形态大致符合,但是角度相差了90度。原因不确定,但可能是参考轴的差异引起。后面需要进一步分析差异原因。