COVID-19
自2019年以来,新冠肺炎(COVID-19)全球感染人数已破亿,死亡超200万。人类拥有的辉煌科技成果和现代文明,在渺小的病毒面前,似乎更加渺小。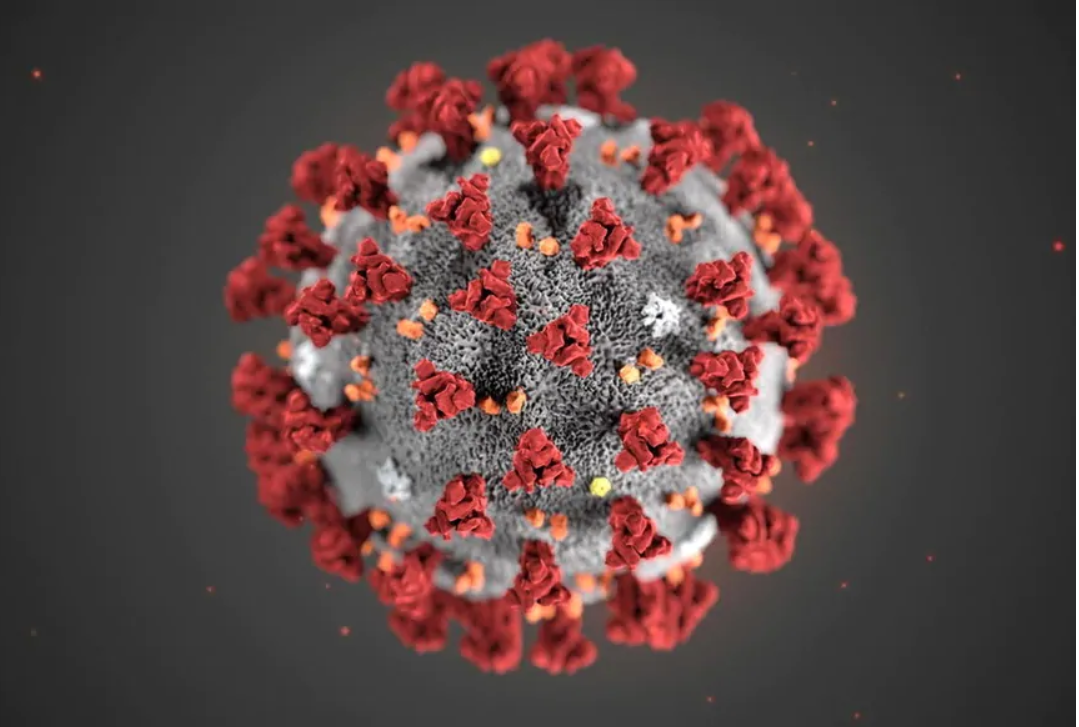
封城
已知的首位新冠肺炎病例2019年末出现武汉,2020年春节期间随春运扩散全国,并迅速在全球流行,武汉成为世界焦点。
为了控制病毒传播,武汉实施了法定甲类传染病的预防控制措施,采取了建国以来首次城市人口流动管制,2020年1月23日,武汉封城。世卫组织称它是“公共卫生史上前所未有的”。
武汉实施限行几小时后,黄冈市、鄂州市等周边城市也陆续实施了限行措施,最终湖北其他15个城市均实施了限行措施,省內共影响约5700万人。2020年3月25日,湖北省开始解封,4月8日,武汉解除封城措施。而在之后的疫情防控常态化时期,也有因疫情反复而进入封锁状态的地区。2020年7月,新疆效仿湖北省,进入封锁状态。2021年1月,河北省石家庄市封城。 资料来源
2020年的湖北政府报告这么说:
2020年是湖北历史上极不平凡、极不容易、极其难忘的一年。
大气
封城导致人口不流动,工厂停滞,交通停滞,湖北一季度GDP增速-39.2%。
同时,封城使得大气污染物排放源头也停滞,绝大部分地区的经济活动都停了下来,包括工厂、工地、交通、餐饮等。这场前所未有的社会管制行为,直接导致地面、大气环境发生了显著的变化,使得我们很容易可以从太空卫星窥探到包括大气污染物浓度变化、城市夜光等的变化。利用遥感大数据来监测封城导致的地球环境变化,在一段时间已成为科学家研究热点,在Science、Nature、Geophysical Research Letters、National Science Review等期刊发表许多文章(这里不讨论病毒和发SCI论文的伦理道德)。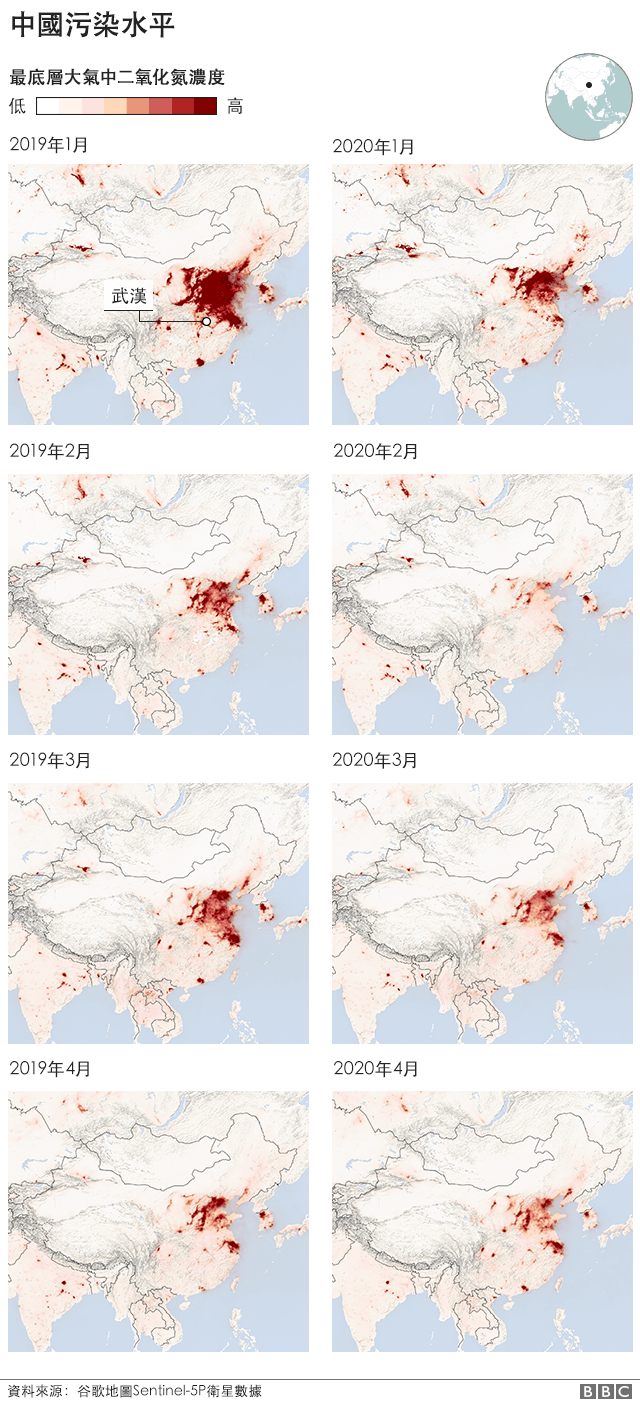
然而武汉封城后,有一段时间污染物浓度不降反升,国外小报据此推测武汉死亡人数上升,空气质量下降是由于焚烧尸体所致。针对这一观点,华人科学家没有沉默,但是也没有陷入唇枪舌战,而是选择用科学说话,在《National Science Review》等期刊上发表文章,探究真相。
如:
[1]HUANG X, DING A, GAO J, 等. Enhanced Secondary Pollution Offset Reduction of Primary Emissions during COVID-19 Lockdown in China[J/OL]. National Science Review, [2020–10–07]. https://academic.oup.com/nsr/advance-article/doi/10.1093/nsr/nwaa137/5859289. DOI:10.1093/nsr/nwaa137.
[2]SU T, LI Z, ZHENG Y, 等. Abnormally Shallow Boundary Layer Associated with Severe Air Pollution during the COVID‐19 Lockdown in China[J/OL]. Geophysical Research Letters, 2020[2020–10–07]. https://onlinelibrary.wiley.com/doi/10.1029/2020GL090041. DOI:10.1029/2020GL090041.
这其实是一种大气的二次污染现象:
Here, using comprehensive measurements and modeling, we show that the haze during the COVID lockdown was driven by enhancements of secondary pollution. In particular, large decreases in NOx emissions from transportation increased ozone and nighttime NO3 radical formation, and these increases in atmospheric oxidizing capacity in turn facilitated the formation of secondary particulate matter.[1]
如此专业的大气污染理论远超小编知识,本文不做探讨。
Sentinel-5P 介绍
非大气专业的一般群众也可以利用Sentinel-5P和GEE遥感大数据平台感受这场人类史无前例的封城带来的地球大气环境变化。
Sentinel-5P 是2017年10月13日由欧空局发射的大气环境监测卫星,主要载荷是Tropomi(对流层监测仪),卫星数据可以从GEE遥感数据平台免费调取和分析。其介绍如下:
Sentinel-5 Precursor mission instrument collects data useful for assessing air quality. The TROPOMI instrument is a multispectral sensor that records reflectance of wavelengths important for measuring atmospheric concentrations of ozone, methane, formaldehyde, aerosol, carbon monoxide, nitrogen oxide, and sulphur dioxide, as well as cloud characteristics at a spatial resolution of 0.01 arc degrees. 来源
GEE
GEE,全称Google Earth Engine,是一个planetary-scale 的地球数据和分析平台,GEE由谷歌云的基础设施驱动,其优点是免费开放、大数据和云端计算。
接下来我们利用GEE大数据平台中的Sentinel-5P看一看2019年和2020年3月份的二氧化氮污染物的同期比较:
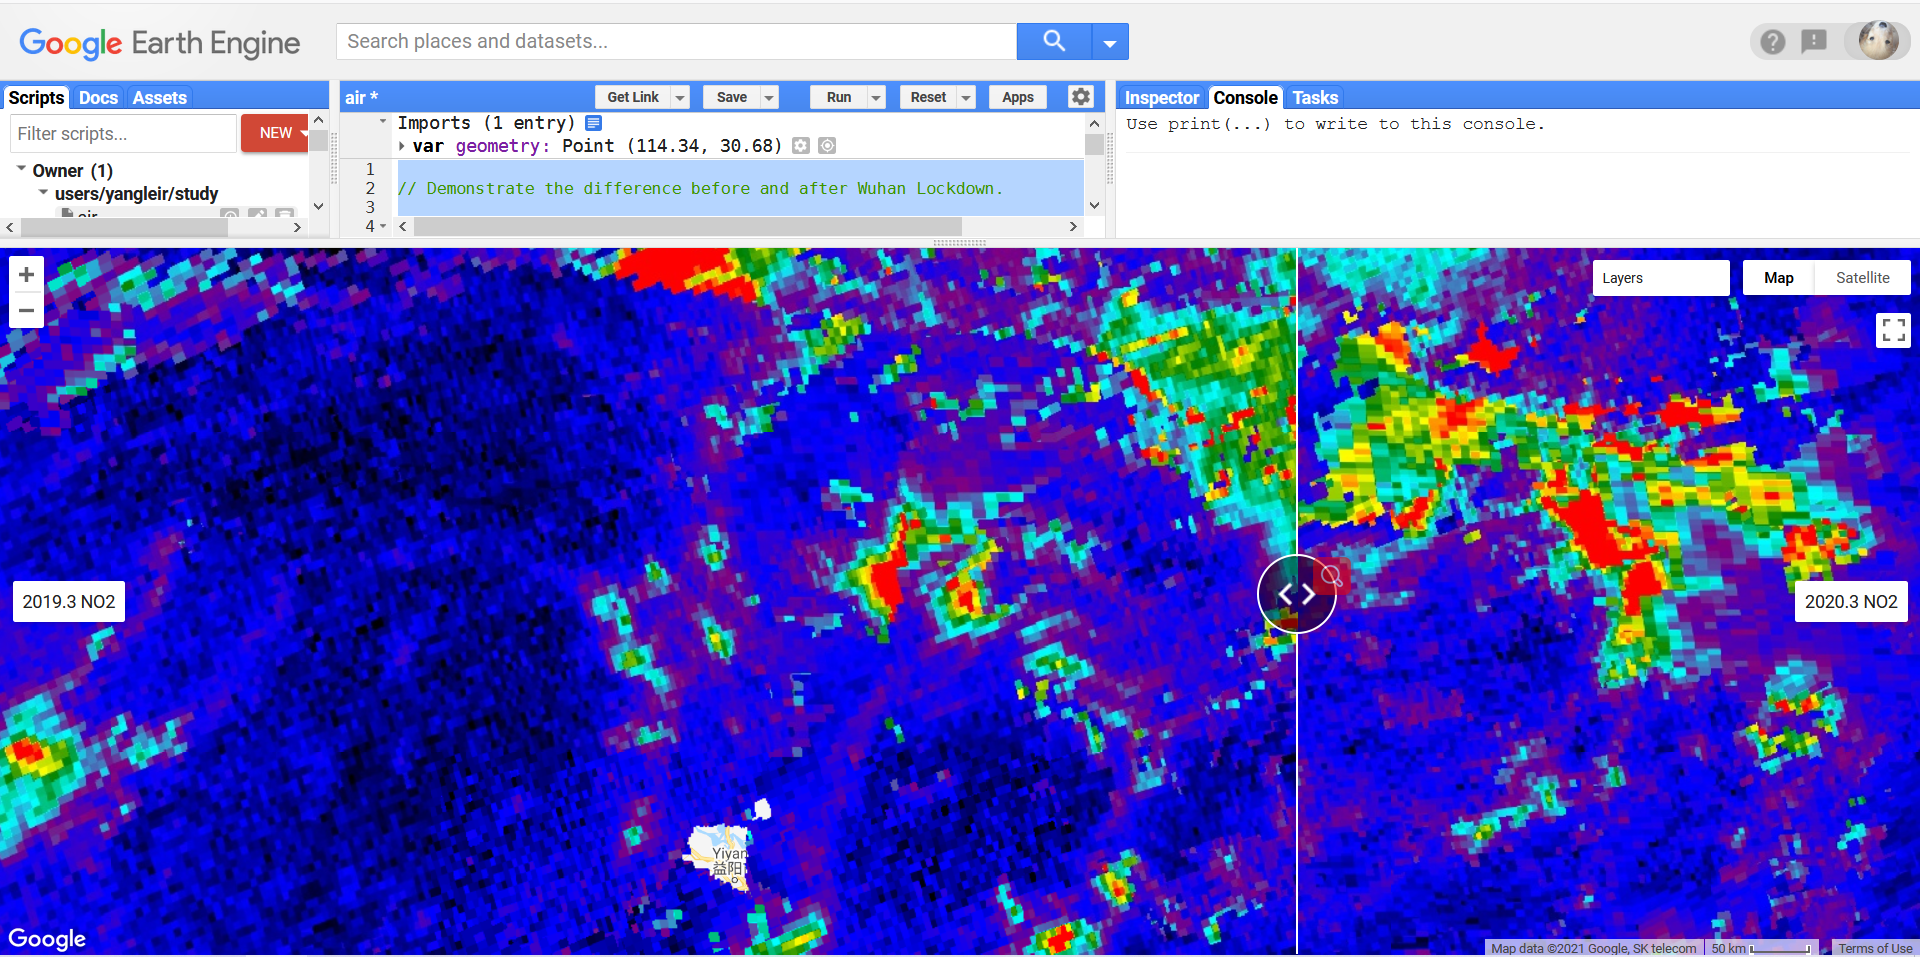
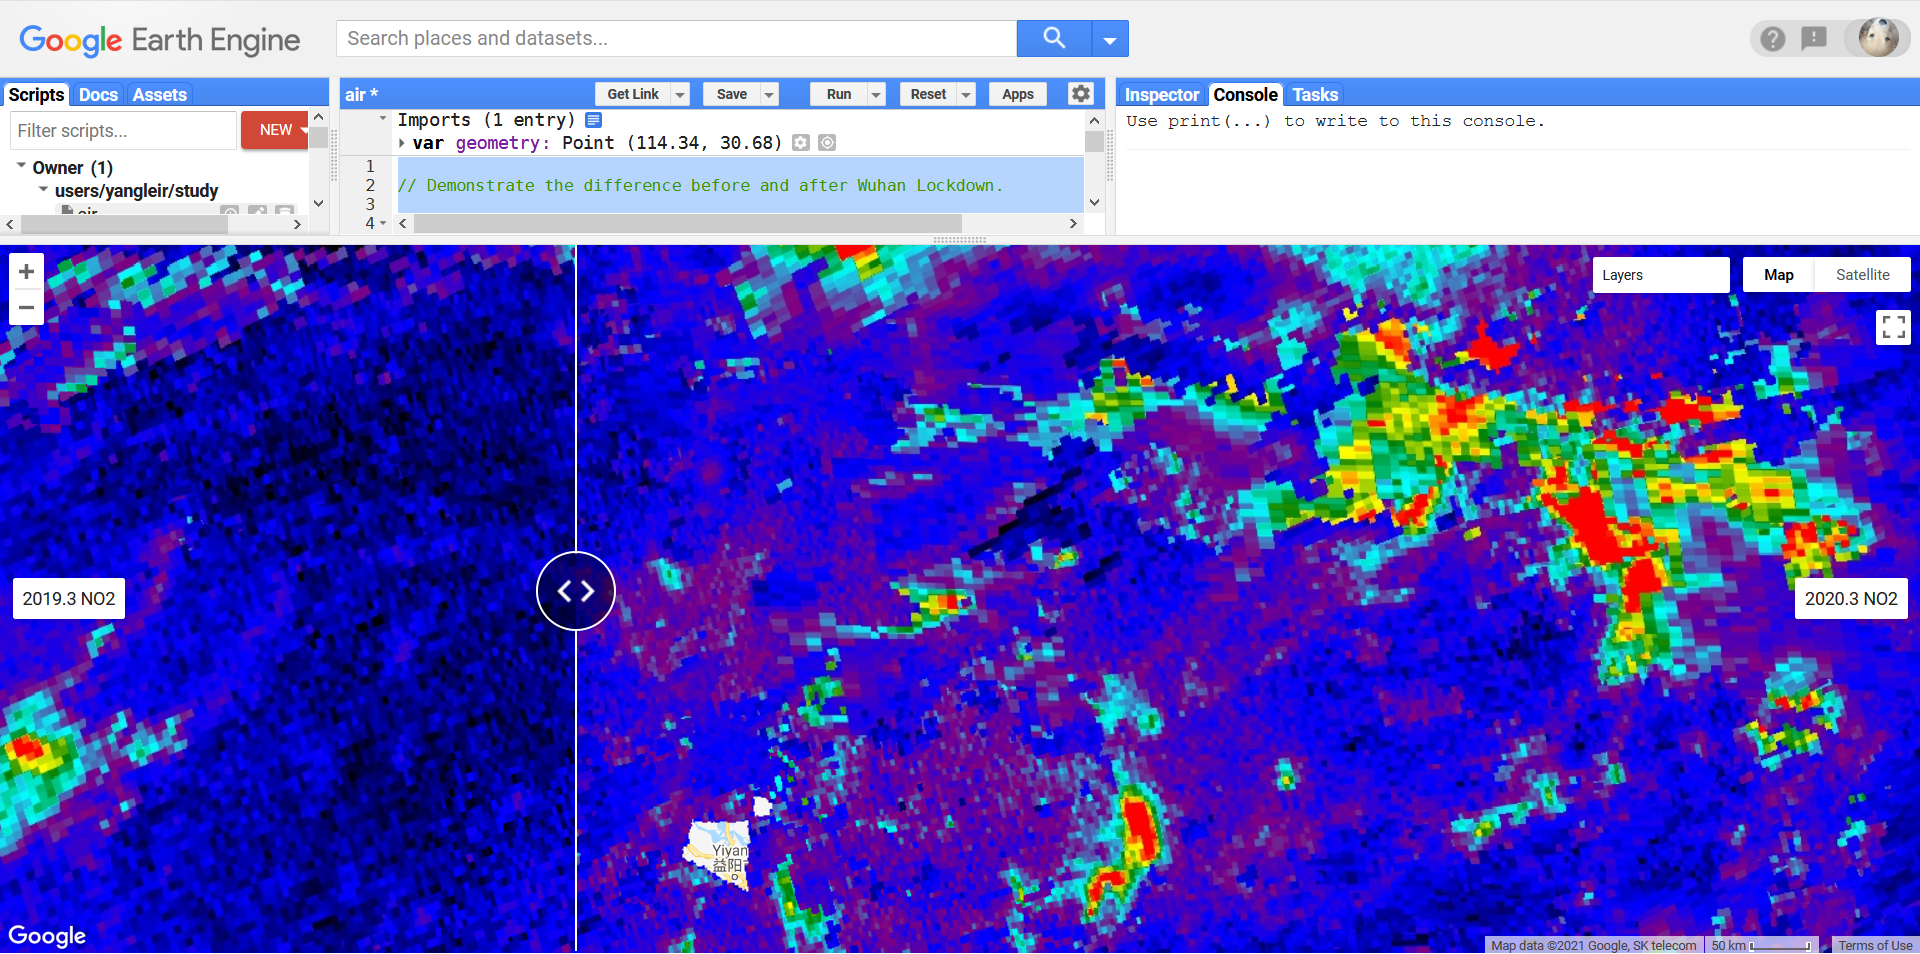

显而易见,2020年3月的NO2浓度下降了。据Sentinel-5P观测数据统计NO2下降幅度达65%,这么大的空气污染物降幅在图像上肉眼可见。
GEE CODE:
1 |
|
进一步可以进行统计量化分析,还可以结合地面空间监测站的实测数据进行精度分析。但是小编比较懒,也比较忙,对遥感大数据和大气环境有兴趣的话,大家可以从这里下载实测数据,做卫星资料的精度检验工作。
参考文献
此领域已经发表大量遥感和大气方向的研究论文,含Science等顶级期刊。封城为人类了解大气污染的原因和机制提供了一次非常难以描述的机会:
[1]WANG P, CHEN K, ZHU S, 等. Severe Air Pollution Events Not Avoided by Reduced Anthropogenic Activities during COVID-19 Outbreak[J]. Resources, Conservation and Recycling, 2020, 158: 104814. DOI:10.1016/j.resconrec.2020.104814.
[2]SUN Y, LEI L, ZHOU W, 等. A Chemical Cocktail during the COVID-19 Outbreak in Beijing, China: Insights from Six-Year Aerosol Particle Composition Measurements during the Chinese New Year Holiday[J]. Science of The Total Environment, 2020, 742: 140739. DOI:10.1016/j.scitotenv.2020.140739.
[3]SU T, LI Z, ZHENG Y, 等. Abnormally Shallow Boundary Layer Associated with Severe Air Pollution during the COVID‐19 Lockdown in China[J/OL]. Geophysical Research Letters, 2020[2020–10–07]. https://onlinelibrary.wiley.com/doi/10.1029/2020GL090041. DOI:10.1029/2020GL090041.
[4]SHI X, BRASSEUR G P. The Response in Air Quality to the Reduction of Chinese Economic Activities During the COVID‐19 Outbreak[J/OL]. Geophysical Research Letters, 2020, 47(11)[2020–10–07]. https://onlinelibrary.wiley.com/doi/abs/10.1029/2020GL088070. DOI:10.1029/2020GL088070.
[5]LIU F, PAGE A, STRODE S A, 等. Abrupt Decline in Tropospheric Nitrogen Dioxide over China after the Outbreak of COVID-19[J]. Science Advances, 2020, 6(28): eabc2992. DOI:10.1126/sciadv.abc2992.
[6]LE T, WANG Y, LIU L, 等. Unexpected Air Pollution with Marked Emission Reductions during the COVID-19 Outbreak in China[J]. Science, 2020, 369(6504): 702–706. DOI:10.1126/science.abb7431.
[7]HUANG X, DING A, GAO J, 等. Enhanced Secondary Pollution Offset Reduction of Primary Emissions during COVID-19 Lockdown in China[J/OL]. National Science Review, 2020[2020–10–07]. https://academic.oup.com/nsr/advance-article/doi/10.1093/nsr/nwaa137/5859289. DOI:10.1093/nsr/nwaa137.
[8]CHANG Y, HUANG R, GE X, 等. Puzzling Haze Events in China During the Coronavirus (COVID‐19) Shutdown[J/OL]. Geophysical Research Letters, 2020, 47(12)[2020–10–07]. https://onlinelibrary.wiley.com/doi/abs/10.1029/2020GL088533. DOI:10.1029/2020GL088533.
[9]BAUWENS M, COMPERNOLLE S, STAVRAKOU T, 等. Impact of Coronavirus Outbreak on NO 2 Pollution Assessed Using TROPOMI and OMI Observations[J/OL]. Geophysical Research Letters, 2020, 47(11)[2020–10–07]. https://onlinelibrary.wiley.com/doi/abs/10.1029/2020GL087978. DOI:10.1029/2020GL087978.